Transformed a black-box breast-cancer classifier into an explainable diagnostic dashboard, coupling real-time risk scores with feature-importance visuals and color-safe confidence bands. The result lets radiologists verify machine insights in under a minute and builds on my earlier work on machine learning study.
University of Nottingham - Machine Learning Developing University of Washington - Data Visualization and UI Prototyping
UX Researcher - lead Interaction and UI Designer - lead ML Engineer
Secondary Research Machine Learning Development Quantitative Data Analysis Data Visualization Research & Design Triangulation Iterative UI/UX Prototyping
Miro Figma Kaggle - Python Vibe Coding: ChatGPT UI/UX Development: Streamlit Github - Python / HTML / CSS
569
tumor samples analyzed
30
diagnostic features examined
10
interactive controls designed
Cura began as a machine learning experiment – a way to explore how tumor characteristics could predict malignancy. But after watching someone close to me navigate the uncertainty of breast cancer diagnostics, and beginning my Master’s in HCDE, I started to see how much was hidden behind black box predictions. This project became a way to explore how ML could be made explainable through humanity-centered design. The result was an interactive diagnostic app designed to be accessible not just for radiologists, but also for students, researchers, and anyone involved in the diagnostic workflow.
"AI, when paired with a radiologist, identified 20% more breast cancer cases than two radiologists."
This project started with a question: how is breast cancer actually diagnosed? I was in a machine learning course at the University of Nottingham, working with a breast cancer dataset. At first, I focused on accuracy of the model, adjusting models, testing features, trying to get better results.
But the deeper I got, the more I wanted to understand what the data couldn’t tell me; the reasoning behind clinical decisions.
Why do aviation professionals avoid seeking mental health support when needed the most?
I led a mixed-methods study analyzing 6,000+ survey responses from pilots and air traffic controllers worldwide, revealing patterns of healthcare avoidance, withheld disclosure, and reliance on informal advice. To understand the reasons behind these behaviors, I conducted semi-structured interviews with commercial pilots to explore how trust, regulation, and professional culture shape mental health disclosure.
“Concerns about certification and career consequences often discourage aviation professionals from seeking mental health support.”
Chawla et al., CHI 2016
This project started with a question: how is breast cancer actually diagnosed? I was in a machine learning course at the University of Nottingham, working with a breast cancer dataset. At first, I focused on accuracy of the model, adjusting models, testing features, trying to get better results.
But the deeper I got, the more I wanted to understand what the data couldn’t tell me; the reasoning behind clinical decisions.
How do radiologists make decisions when the signs aren’t obvious?
When someone close to me was diagnosed with breast cancer, I saw how much uncertainty surrounds the diagnostic process. It made me curious about how design and machine learning could bring more clarity and confidence to real-world diagnosis. That experience stayed with me, and I got the chance to pick the project back up with the University of Washington to explore those possibilities further.
"Misdiagnosis and overdiagnosis remain key challenges in breast cancer imaging, where conventional mammography may fail to detect lesions."
This project started with a question: how is breast cancer actually diagnosed? I was in a machine learning course at the University of Nottingham, working with a breast cancer dataset. At first, I focused on accuracy of the model, adjusting models, testing features, trying to get better results.
But the deeper I got, the more I wanted to understand what the data couldn’t tell me; the reasoning behind clinical decisions.
Breakups can feel like grief – sudden, isolating, and overwhelming.
And yet, the digital tools available often emphasize little more than ‘just move on.’ We asked, what would it look like to treat heartbreak not just as pain to ignore, but as an experience to grow from?
"85% of US adults report experiencing a romantic breakup, with 1/3 of those individuals experiencing clinically significant depressive symptoms"
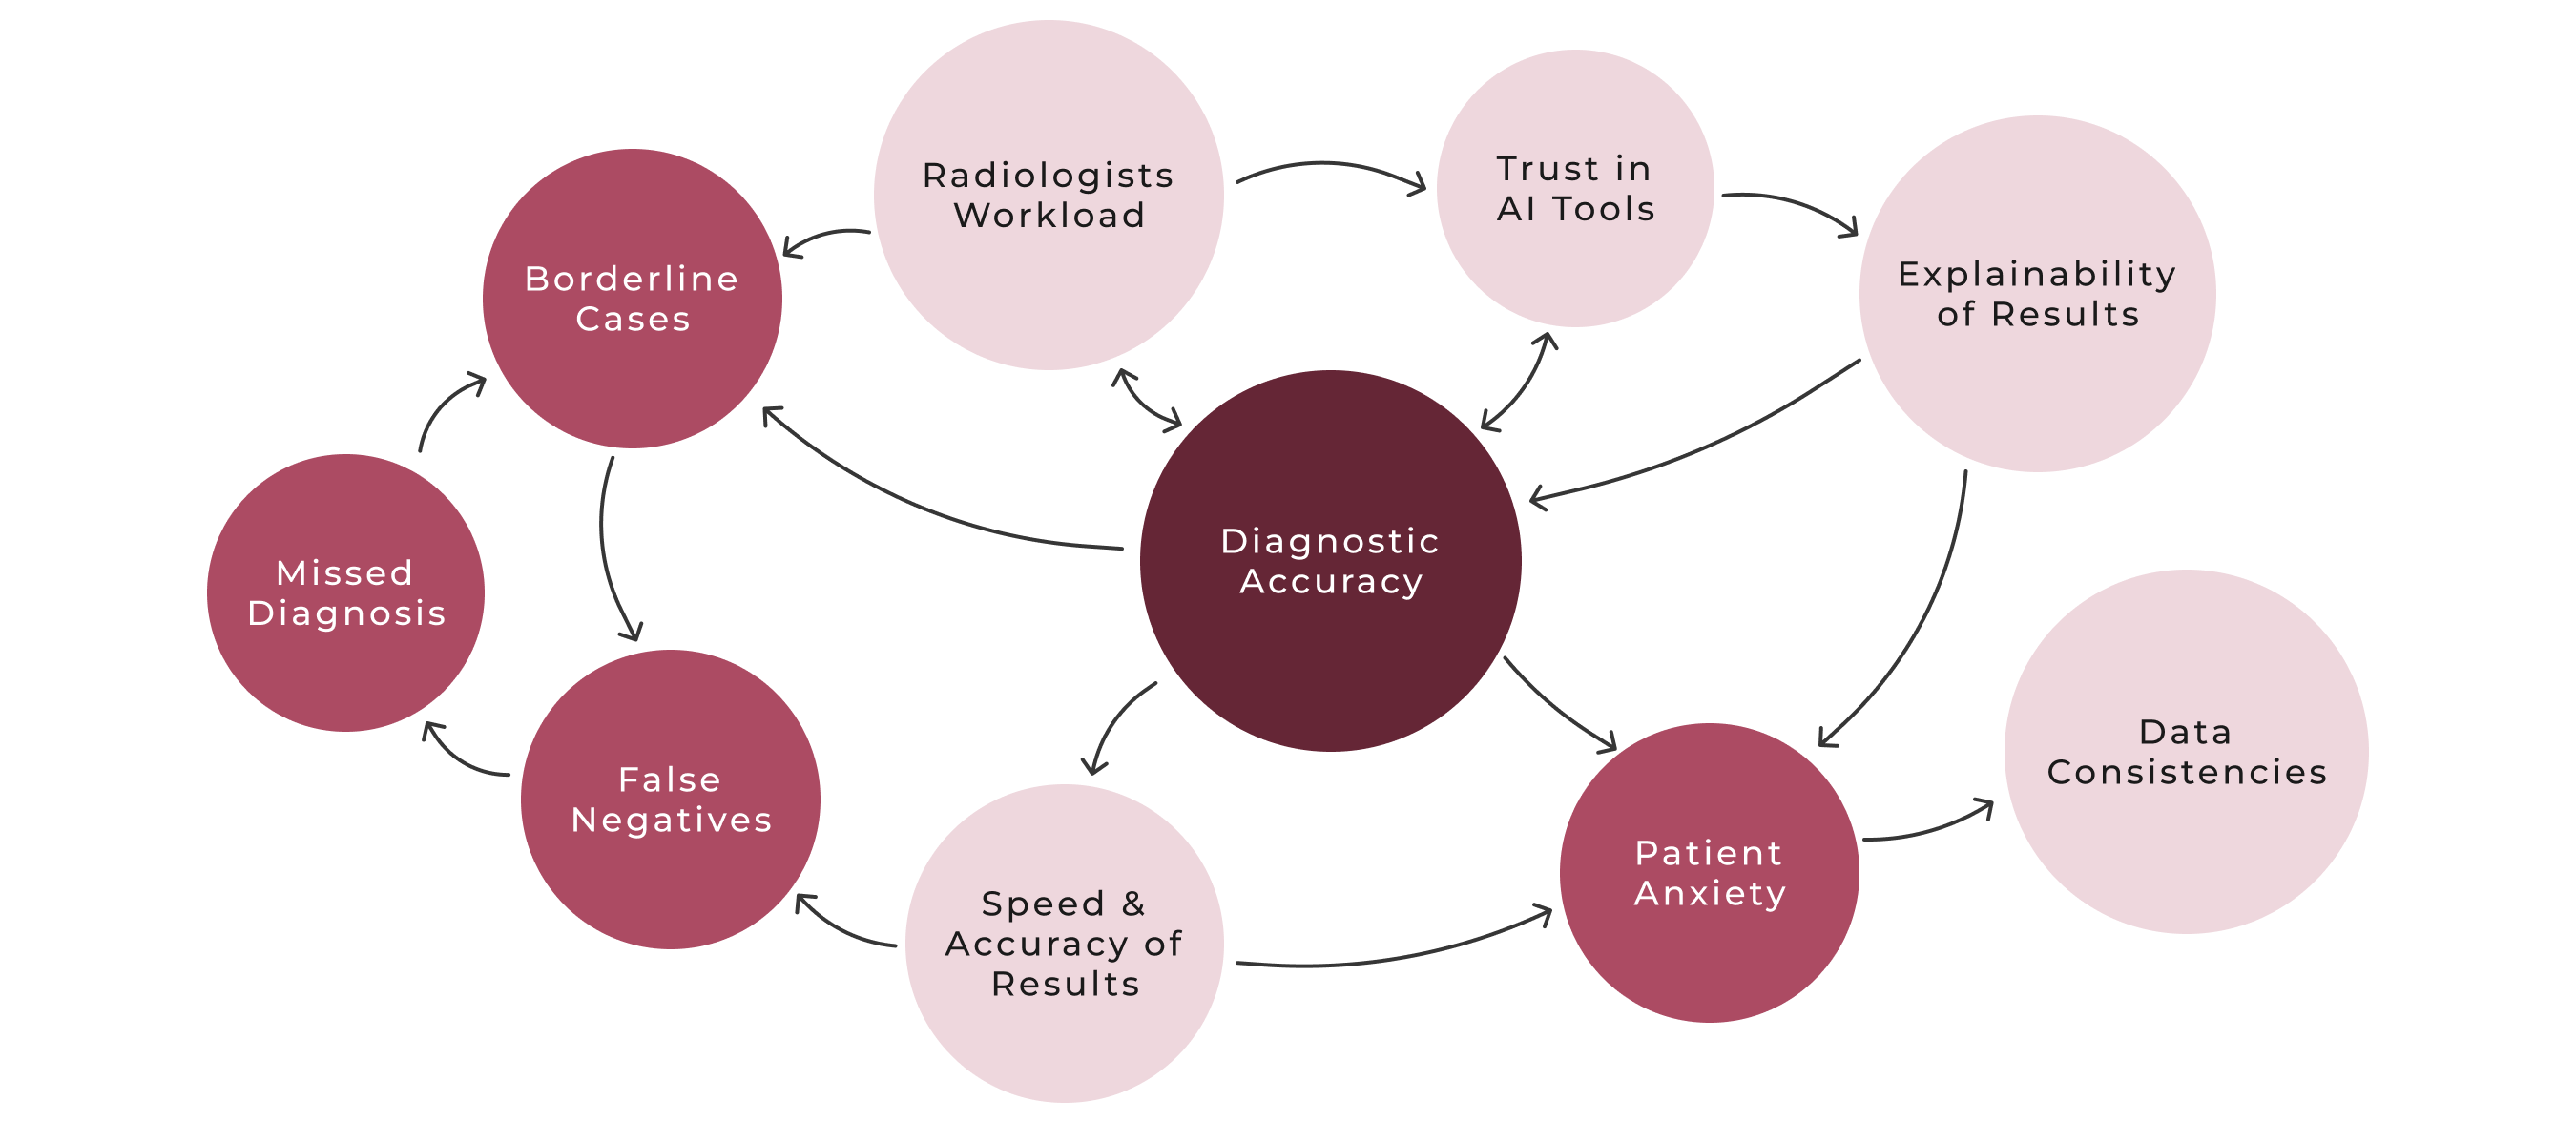
One of the biggest challenges we encountered was rooted in the complexity of diagnosis. Despite the availability of tumor metrics and imaging data, determining whether a tumor is benign or malignant isn’t always clear-cut. Reading imaging data like mammograms or ultrasound scans is highly nuanced and often subjective. Small differences in shape, margin, or density can be hard to interpret and may lead to inconsistent assessments across clinicians, especially in borderline or low-quality cases.
How might we enable AI-mediated mental health support to feel safe and trustworthy for aviation professionals?
One of the biggest challenges we encountered was rooted in the complexity of diagnosis. Despite the availability of tumor metrics and imaging data, determining whether a tumor is benign or malignant isn’t always clear-cut. Reading imaging data like mammograms or ultrasound scans is highly nuanced and often subjective. Small differences in shape, margin, or density can be hard to interpret and may lead to inconsistent assessments across clinicians, especially in borderline or low-quality cases.
How might we create tools that make cancer diagnostic data more interpretable, transparent, and actionable for radiologists?
One of the biggest challenges we encountered was rooted in the complexity of diagnosis. Despite the availability of tumor metrics and imaging data, determining whether a tumor is benign or malignant isn’t always clear-cut. Reading imaging data like mammograms or ultrasound scans is highly nuanced and often subjective. Small differences in shape, margin, or density can be hard to interpret and may lead to inconsistent assessments across clinicians, especially in borderline or low-quality cases.
How might we create a digital experience that adapts to the psychological realities of breakup recovery, including attachment styles, identity loss, and emotional dysregulation, while remaining clinically grounded and deeply human?
Our purpose was to develop a foundational understanding of pilot mental health, reporting barriers, and emerging AI-supported interventions in aviation.
Findings informed a peer-reviewed publication at the AHFE Conference.
To understand how mental health support operates within aviation, I conducted stakeholder interviews with aviation professionals and domain experts. These conversations helped map the regulatory environment, available support resources, and how pilots navigate reporting requirements.
Stakeholders noted that Aviation Medical Examiners (AMEs) have broad authority to question and evaluate pilots during medical certification, which can make pilots reluctant to seek advice or disclose emerging mental health concerns.
How does the aviation mental health system actually work?
To understand broader perceptions of mental health in aviation we conducted a large-scale mixed-methods survey combining likert-scale questions with open-ended responses. The survey was distributed across aviation communities and public channels, resulting in 6,000+ responses that provided insight into how people perceive mental health support in safety-critical professions.
98%
76%
63%
13%
To better understand why pilots make mental health decisions within aviation systems, we conducted 13 semi-structured interviews with pilots across different experience levels. These conversations helped uncover the motivations and concerns shaping decisions around care-seeking, disclosure, and trust.
8 key themes.
Trust, risk, and the role of AI in pilot mental health.
We asked pilots to respond to vignette-based scenarios designed to explore how they navigate mental health challenges in aviation and whether AI-mediated support could realistically help in those situations.
We started by looking into existing research to understand why diagnosing breast cancer is often so complex. Radiologists interpret features like shape, margin, and density differently, and even small changes can lead to different outcomes. This is especially true in borderline cases or when images aren’t clear. These insights helped us focus on where and why the problem exists and to design tools that support clinical judgment.
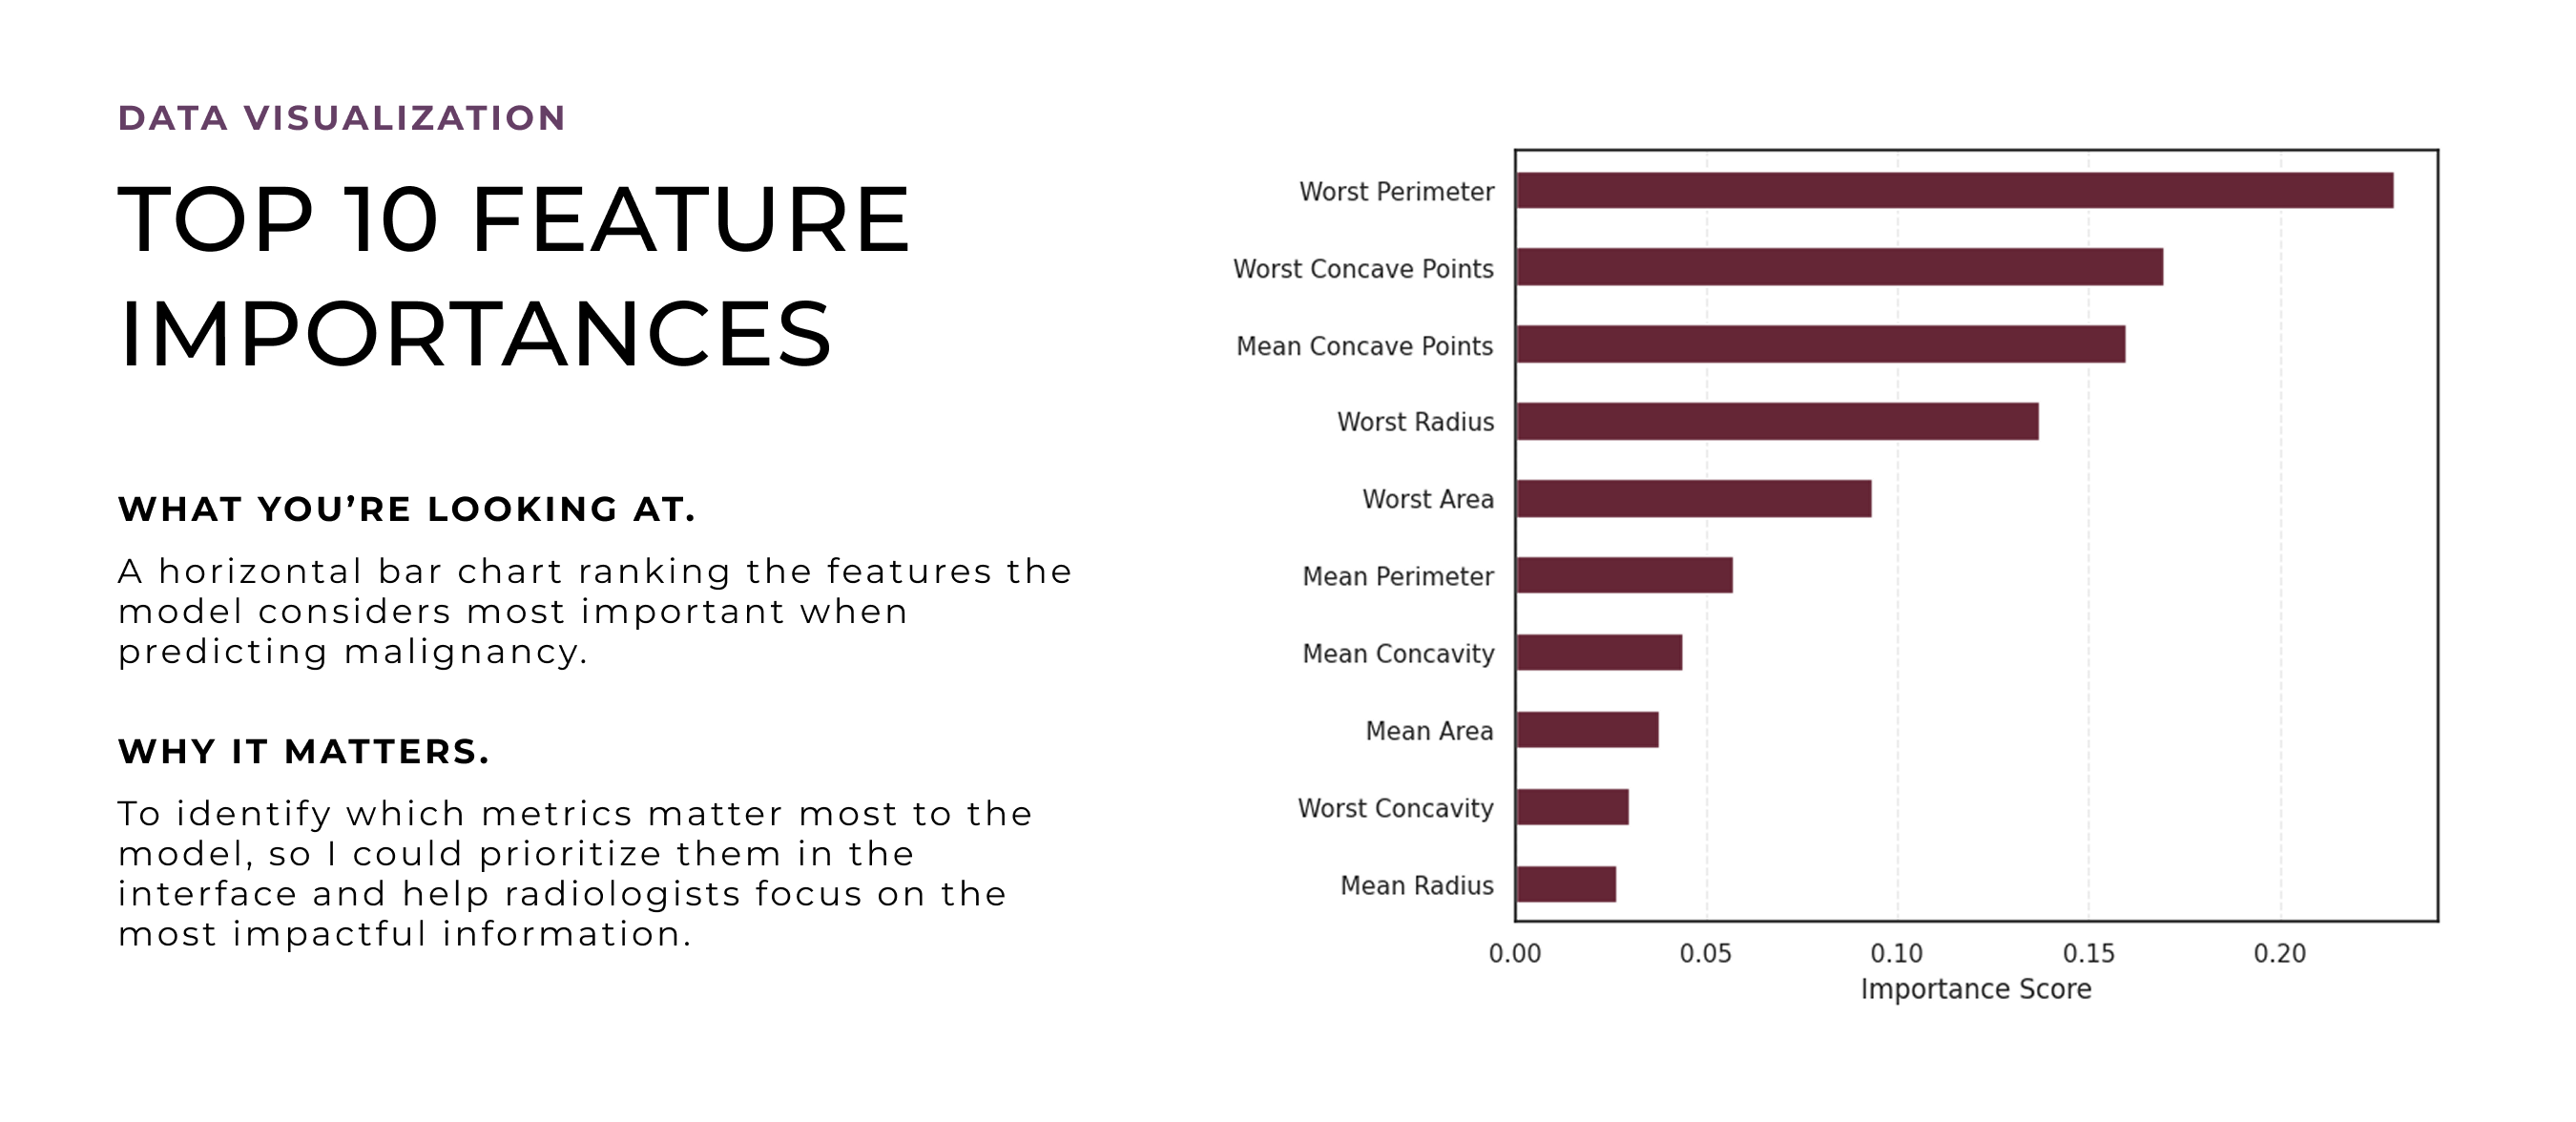
The machine learning model was built early on, during my time at University of Nottingham, as a way to explore how tumor characteristics could predict malignancy and patterns, especially whether those patterns aligned with how radiologists make decisions. At that stage, I didn’t know this would evolve into a design project. But training the model helped uncover which features were most influential, which later became critical input for designing an interface that could surface meaningful, case-specific insights and support clinical reasoning.
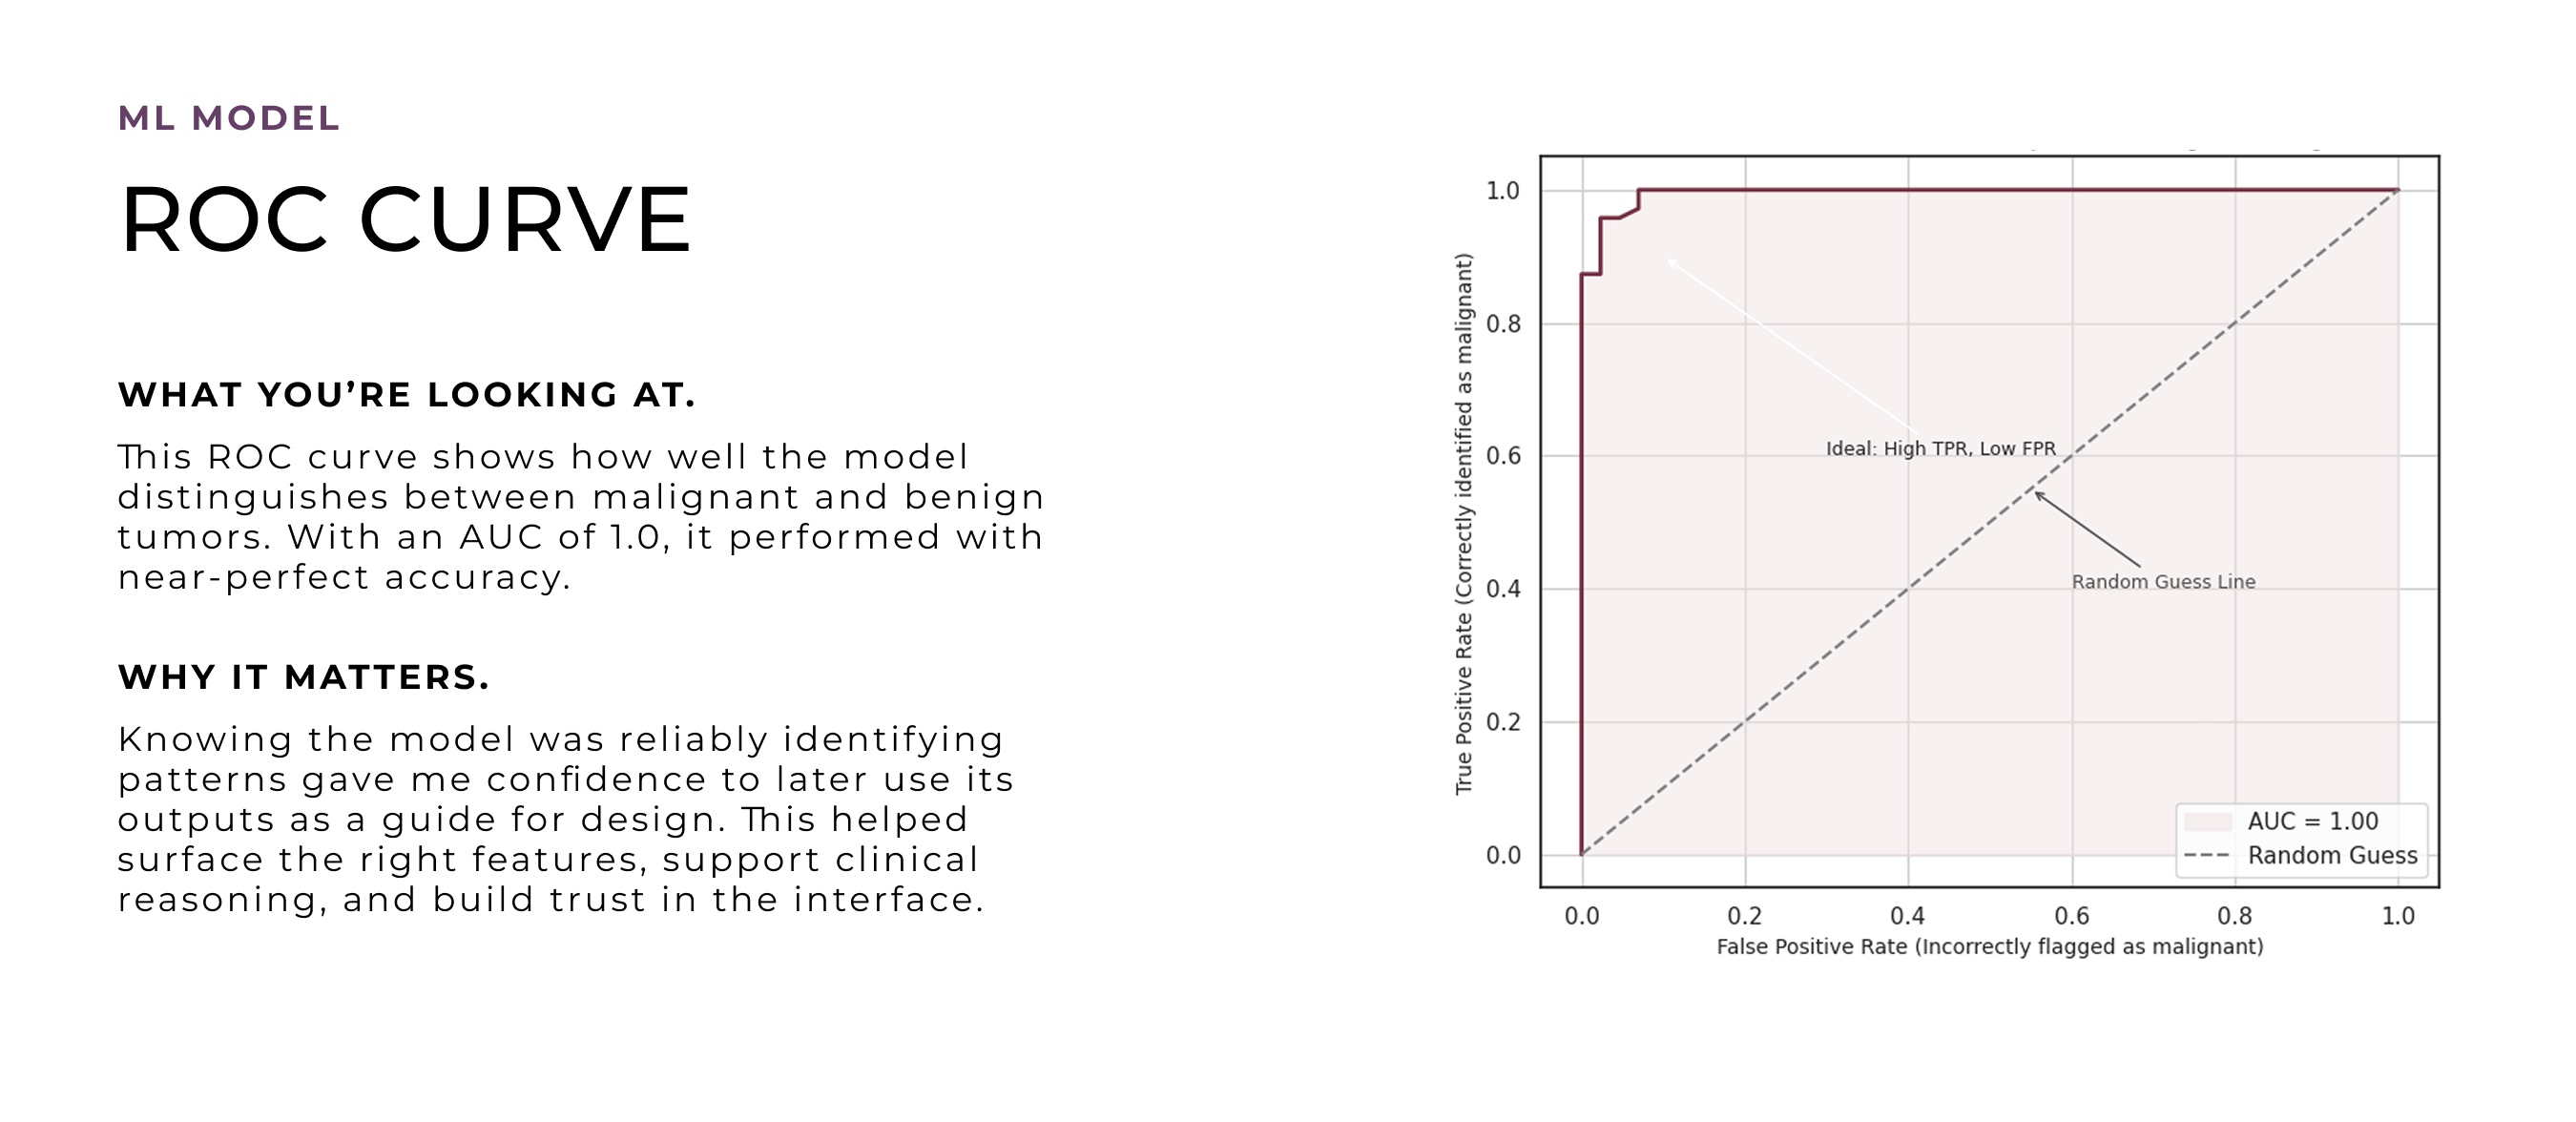
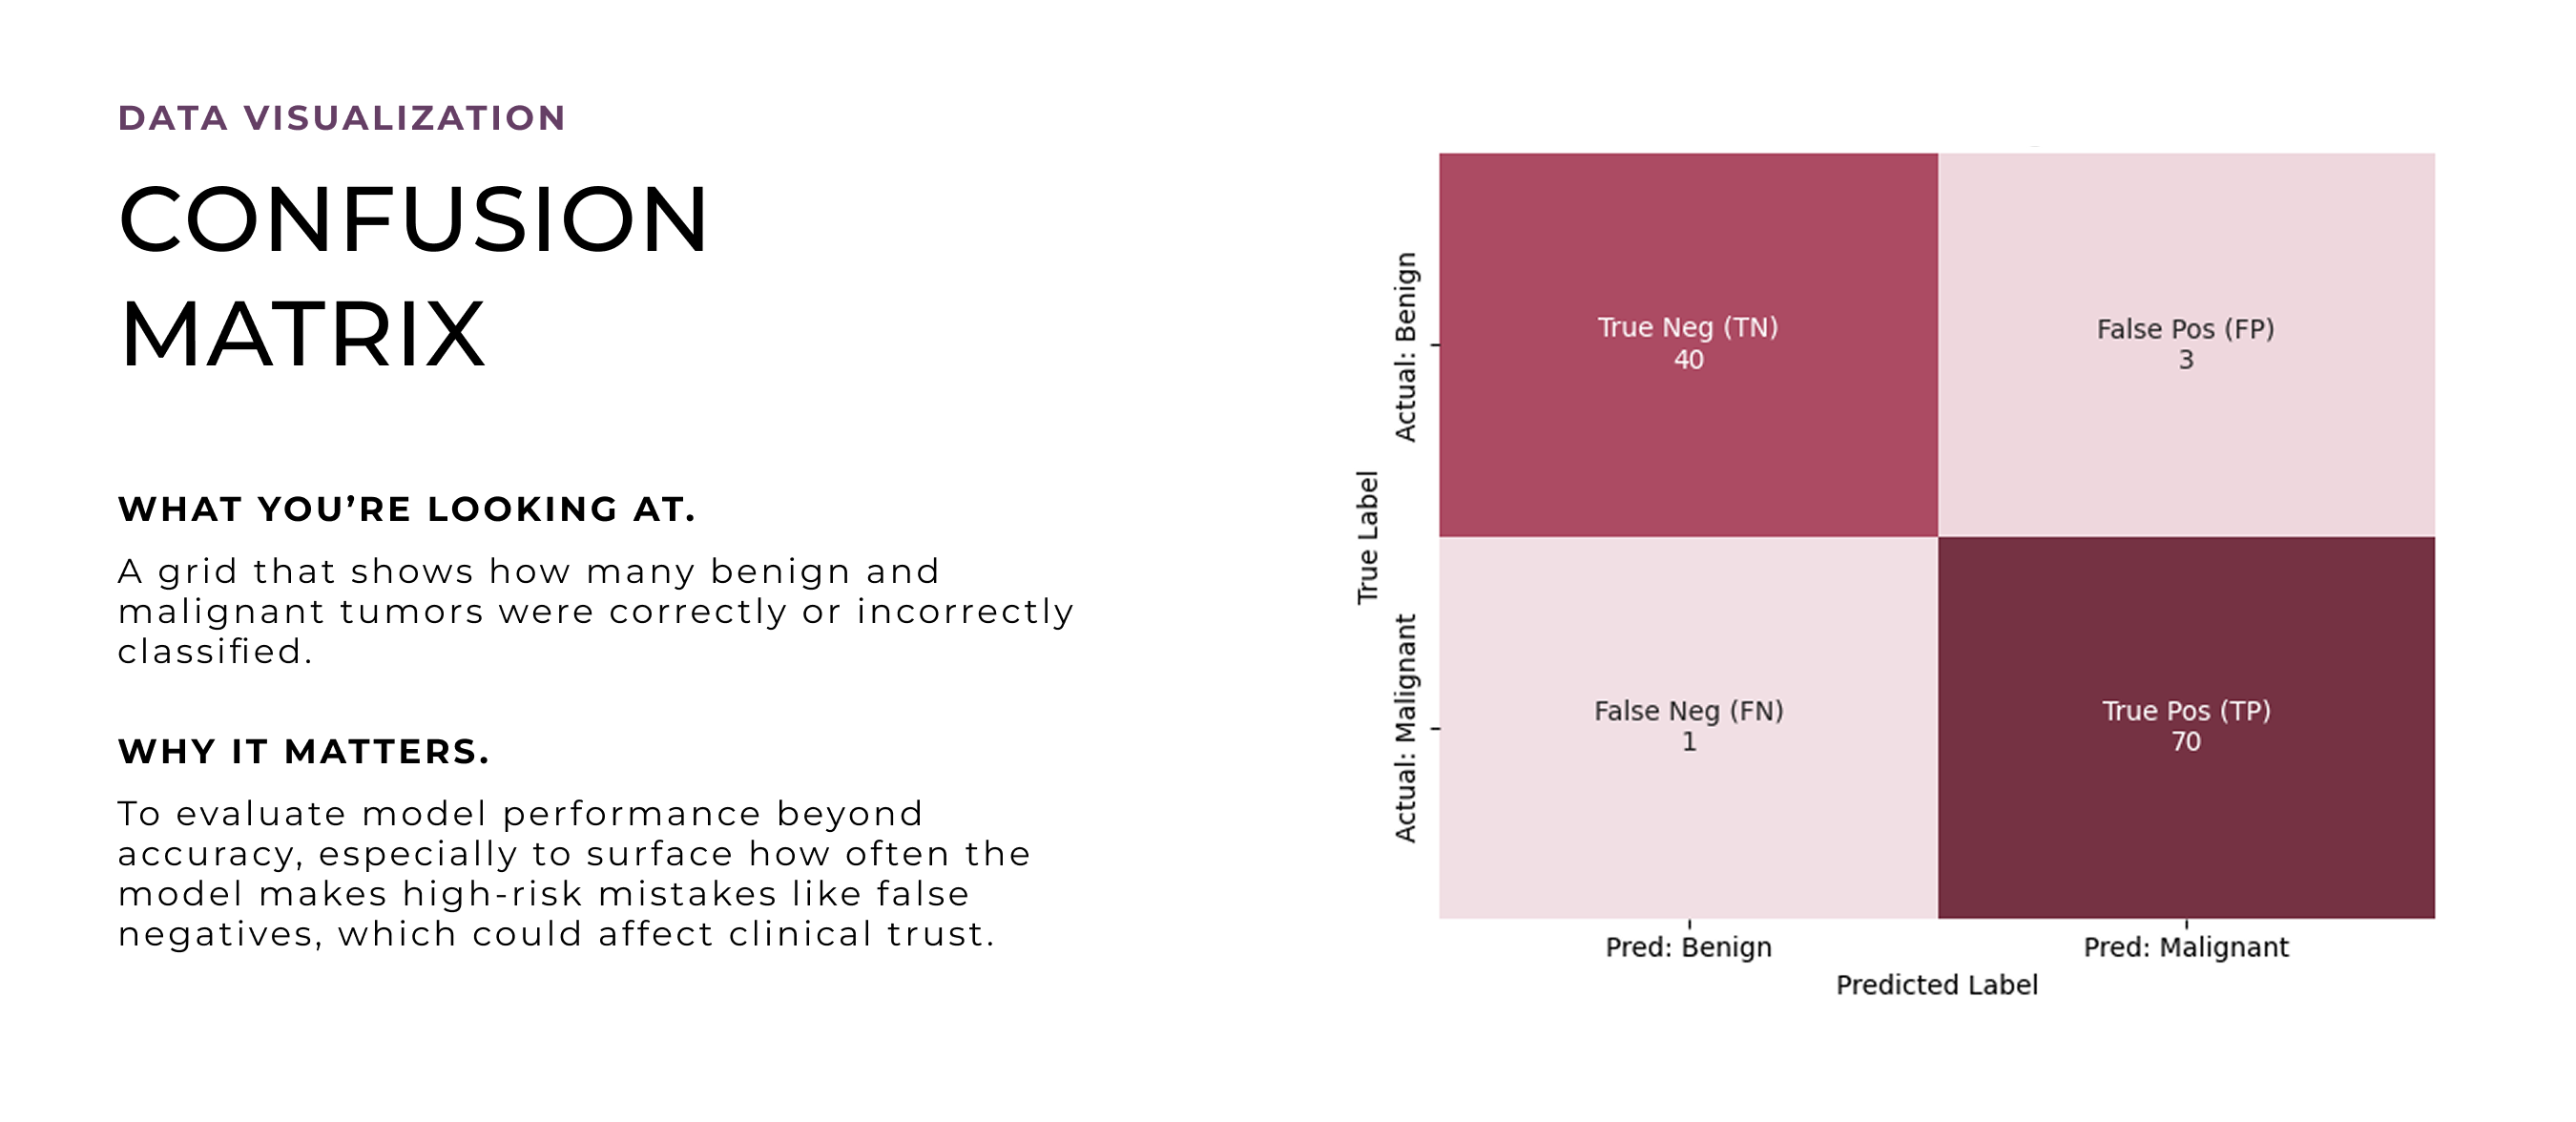
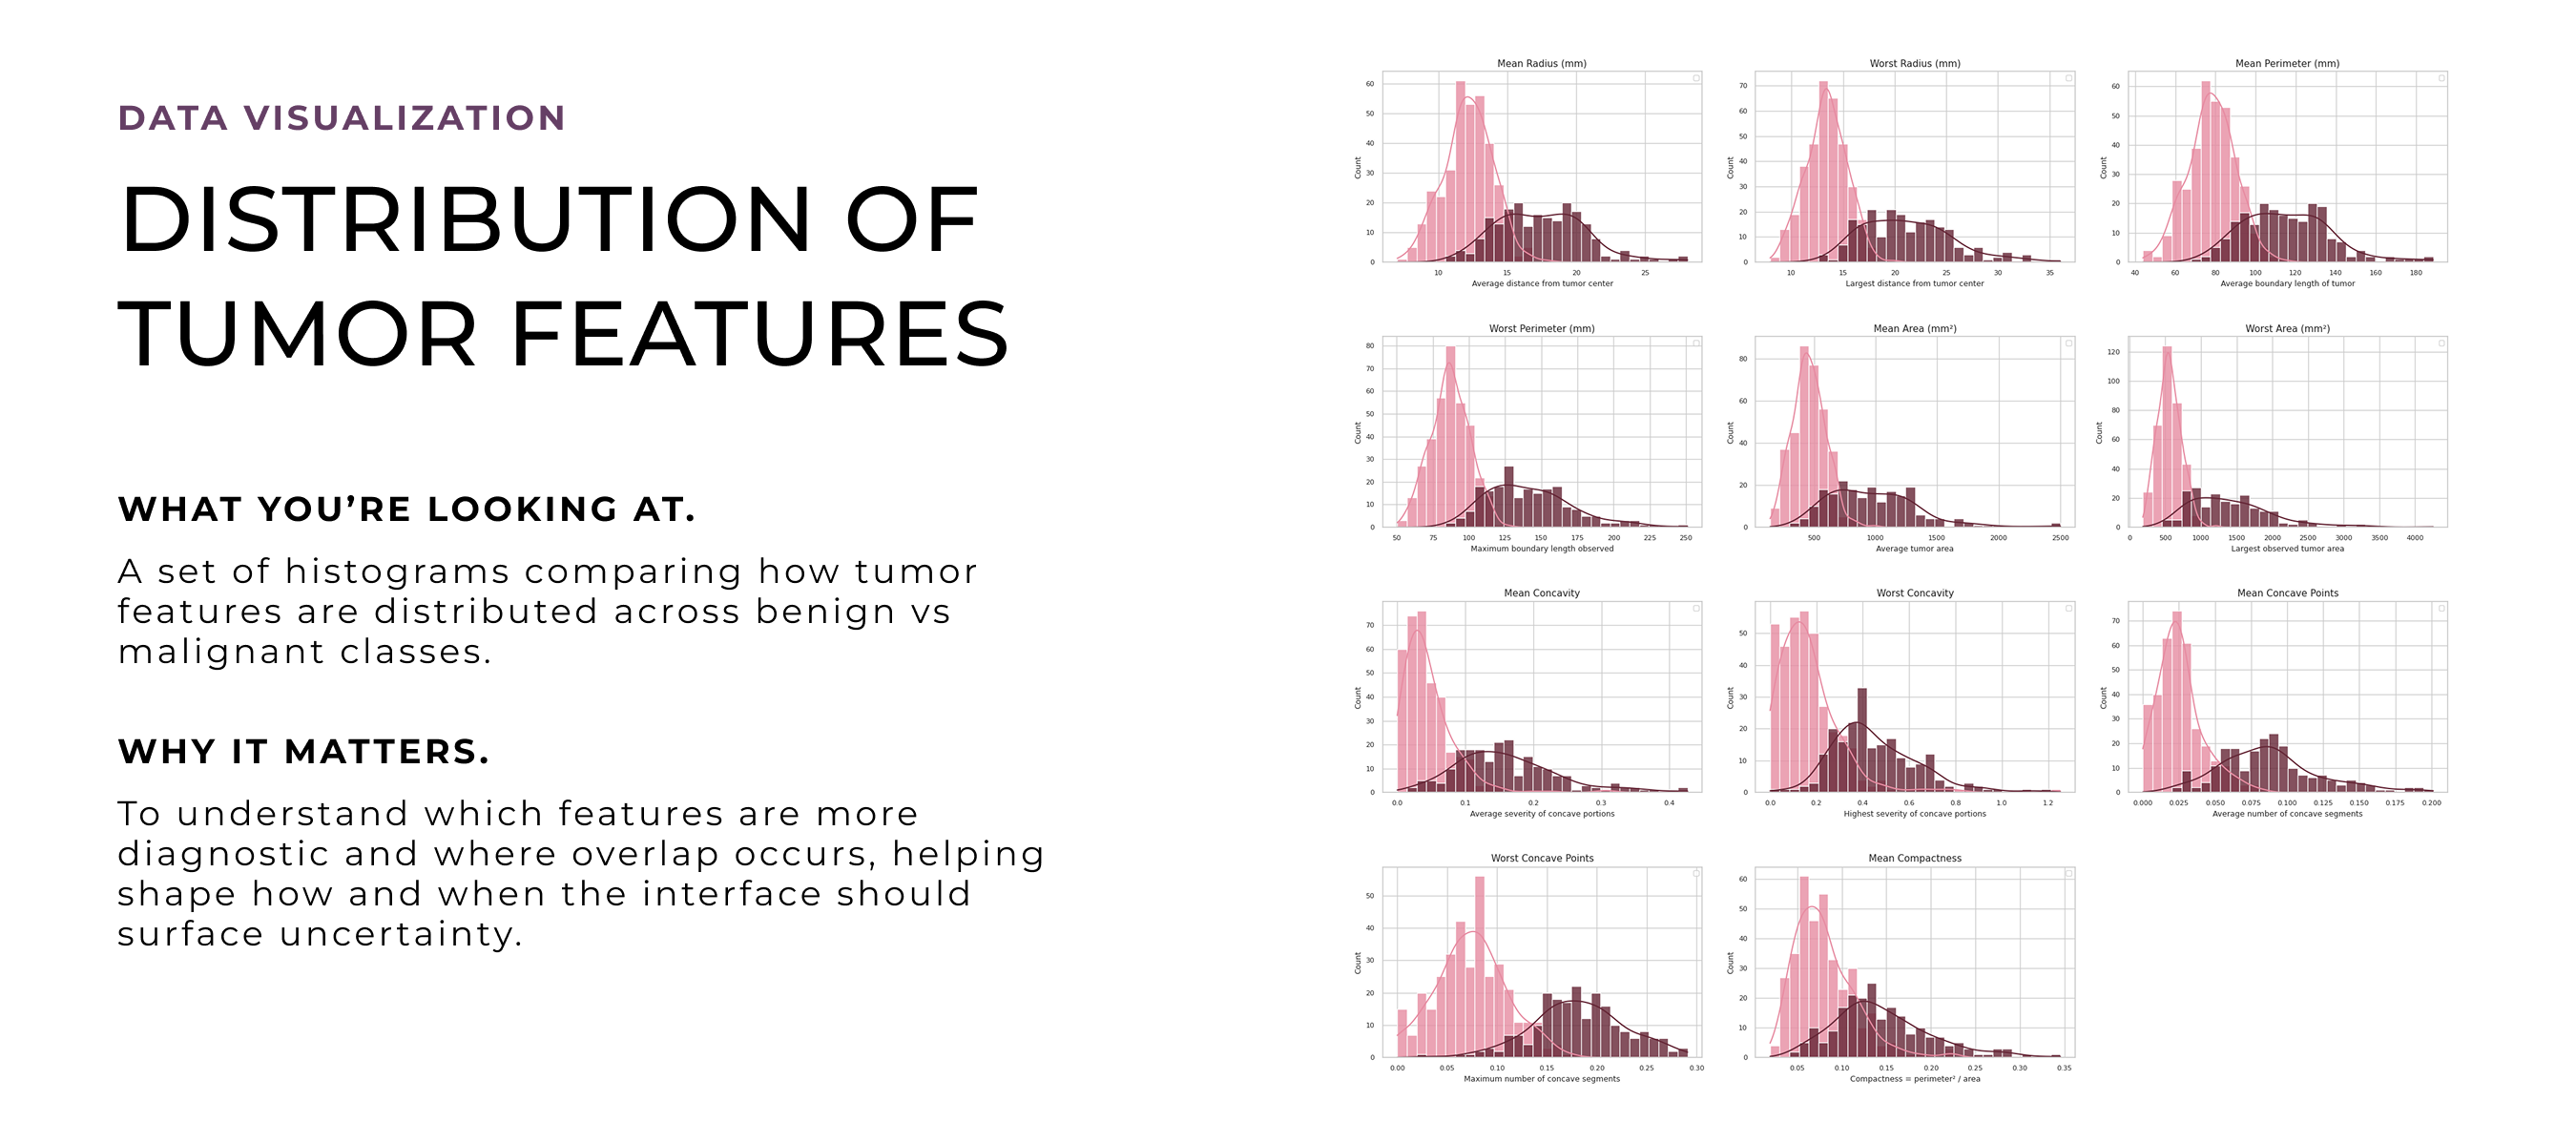
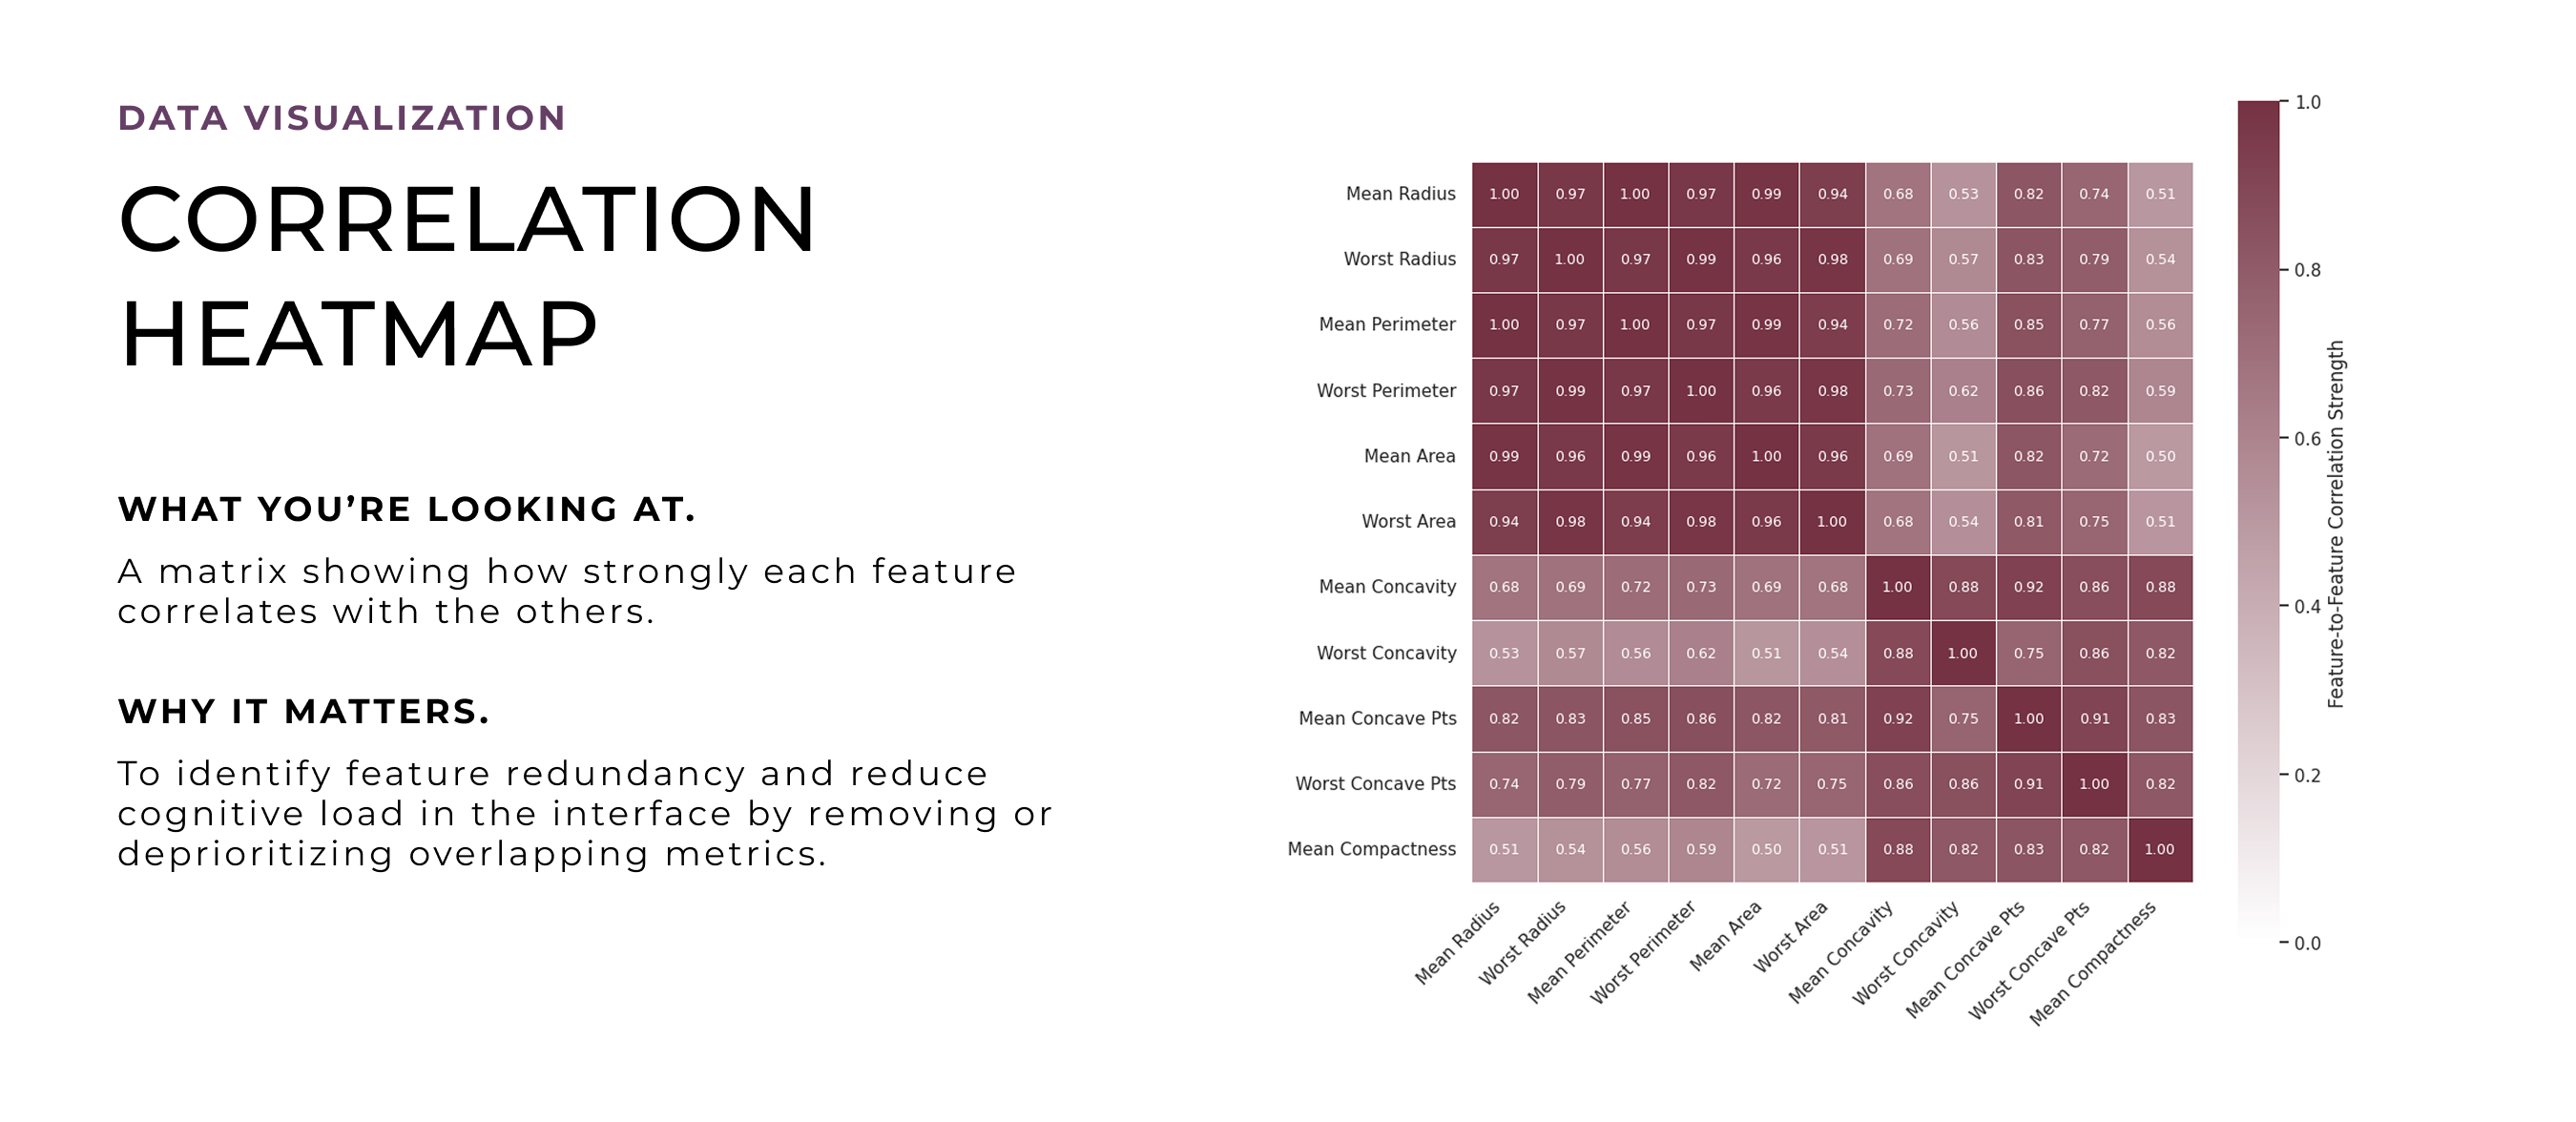
After deciding to turn this into a design project, I revisited the model through deeper quantitative analysis to unpack how its predictions worked in detail. I wanted to explore which features to emphasize, how uncertainty showed up in the data, and where edge cases might cause confusion. These visualizations helped shape the design direction, especially around what to prioritize, how to handle ambiguity, and how to build trust through clarity and transparency.
I began with secondary and market research to understand how common breakups are, how deeply they affect people, and whether there were any patterns in how we experience or cope with them. This helped identify gaps in how breakups are discussed and in the tools currently available for recovery.
I conducted a competitive analysis to understand how existing breakup and emotional recovery tools approach the problem and where gaps exist. Many apps relied on generic, self-guided content that does not adapt to users’ emotional needs. Evaluating usability, tone, and engagement patterns helped identify opportunities for more personalized and emotionally supportive experiences.
After the competitive analysis and literature review, I designed a survey to understand what people actually experience after a breakup at a larger scale. This helped validate early patterns, capture insights from a diverse group of participants, and identify key segments to inform future design decisions.
The findings validated a real, unmet need for breakup support that feels personal, responsive, and human – shaping the foundation of our product vision.
After the survey, we conducted 12 follow-up interviews with participants who had recently experienced a breakup. These conversations helped uncover deeper emotional needs and why existing tools often fall short in supporting people through breakup recovery.
8 key findings. Raw, emotional, high impact.
They revealed why breakups disrupt everyday life and emotional stability, and the need for compassion, community, and support. These insights shaped Repose into a focused recovery tool designed to offer structure, emotional guidance, and self-directed healing.
Insights were validated across secondary research, large-scale surveys, and semi-structured interviews. Triangulating findings helped identify consistent patterns shaping how pilots evaluate mental health concerns and navigate support decisions.
3 Methods. 5 Key Insights.
Cross-Validated Findings.
Interviews revealed that pilots rarely move linearly through support decisions. Instead, certification risk, system distrust, and uncertainty about support pathways create loops that delay help-seeking.
“It’s not that pilots don’t want help. It’s that the system makes you think twice about asking.”
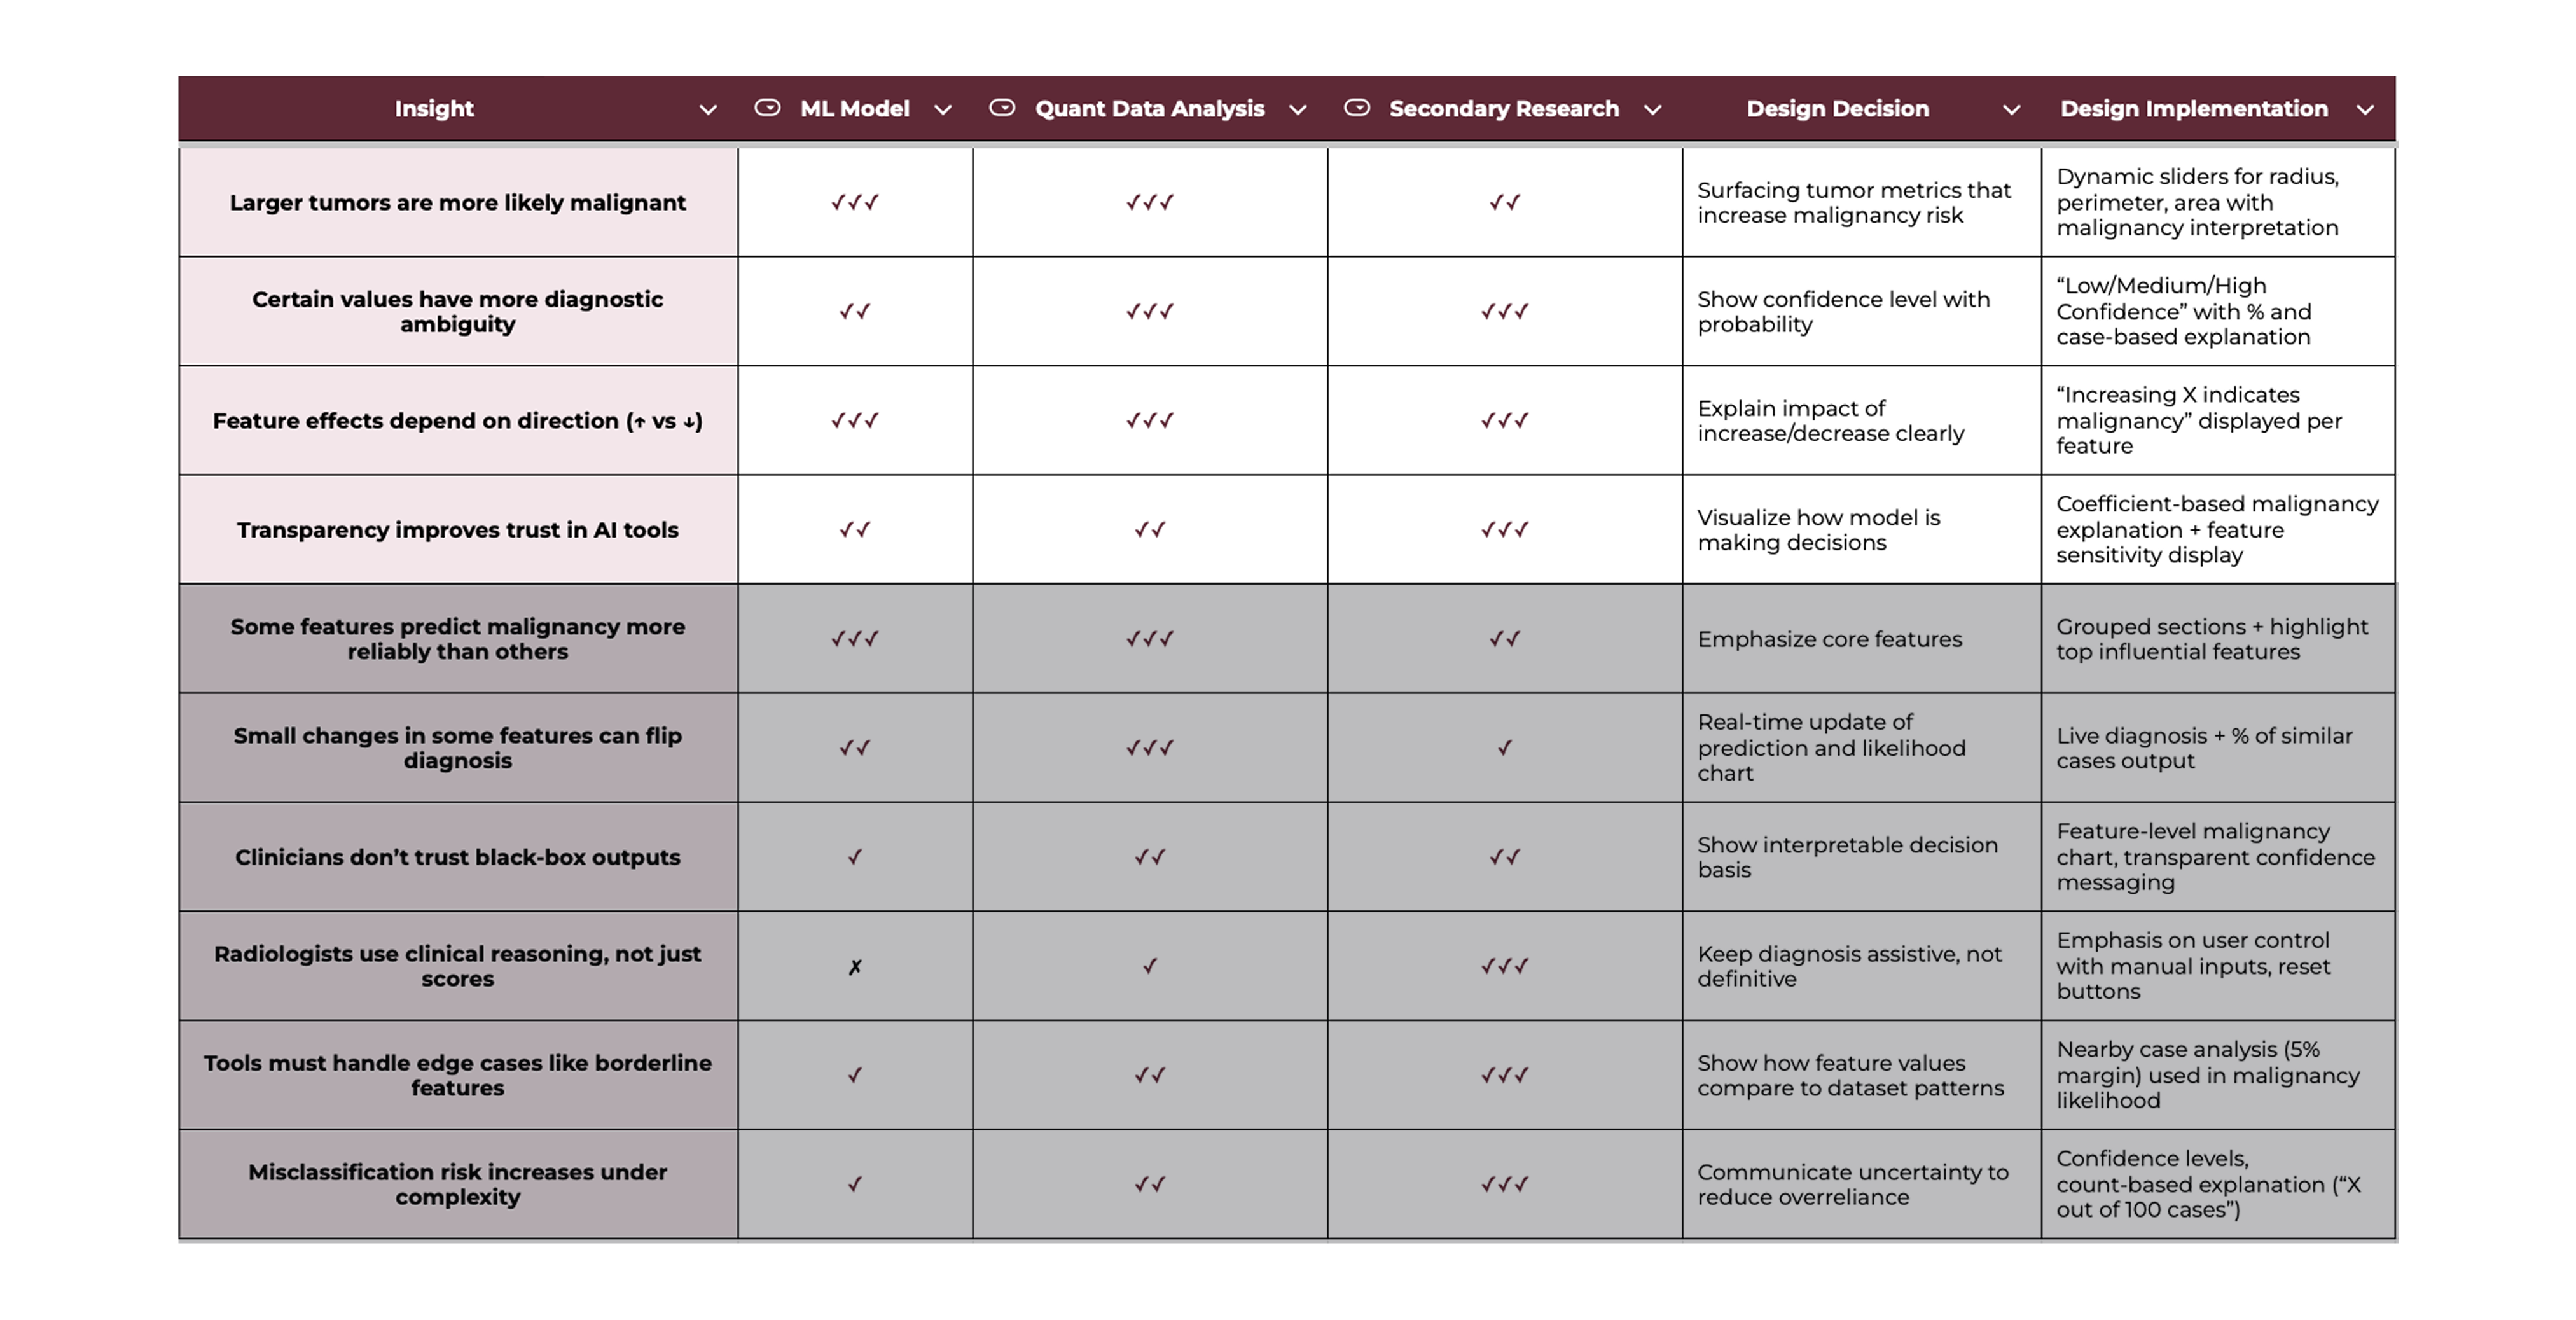
Before designing the interface, I needed to understand how diagnostic decisions break down – in models, in data, and in clinical workflows. I triangulated three methods to create a research-to-design matrix that helped validate patterns across sources and identify high-confidence insights. The matrix surfaced ten core findings that revealed where errors happen, what users actually need, and how AI predictions can be made more interpretable. These insights became the foundation for every UI decision that followed.
3 methods; 10 findings; 4 that deeply shaped the interface.
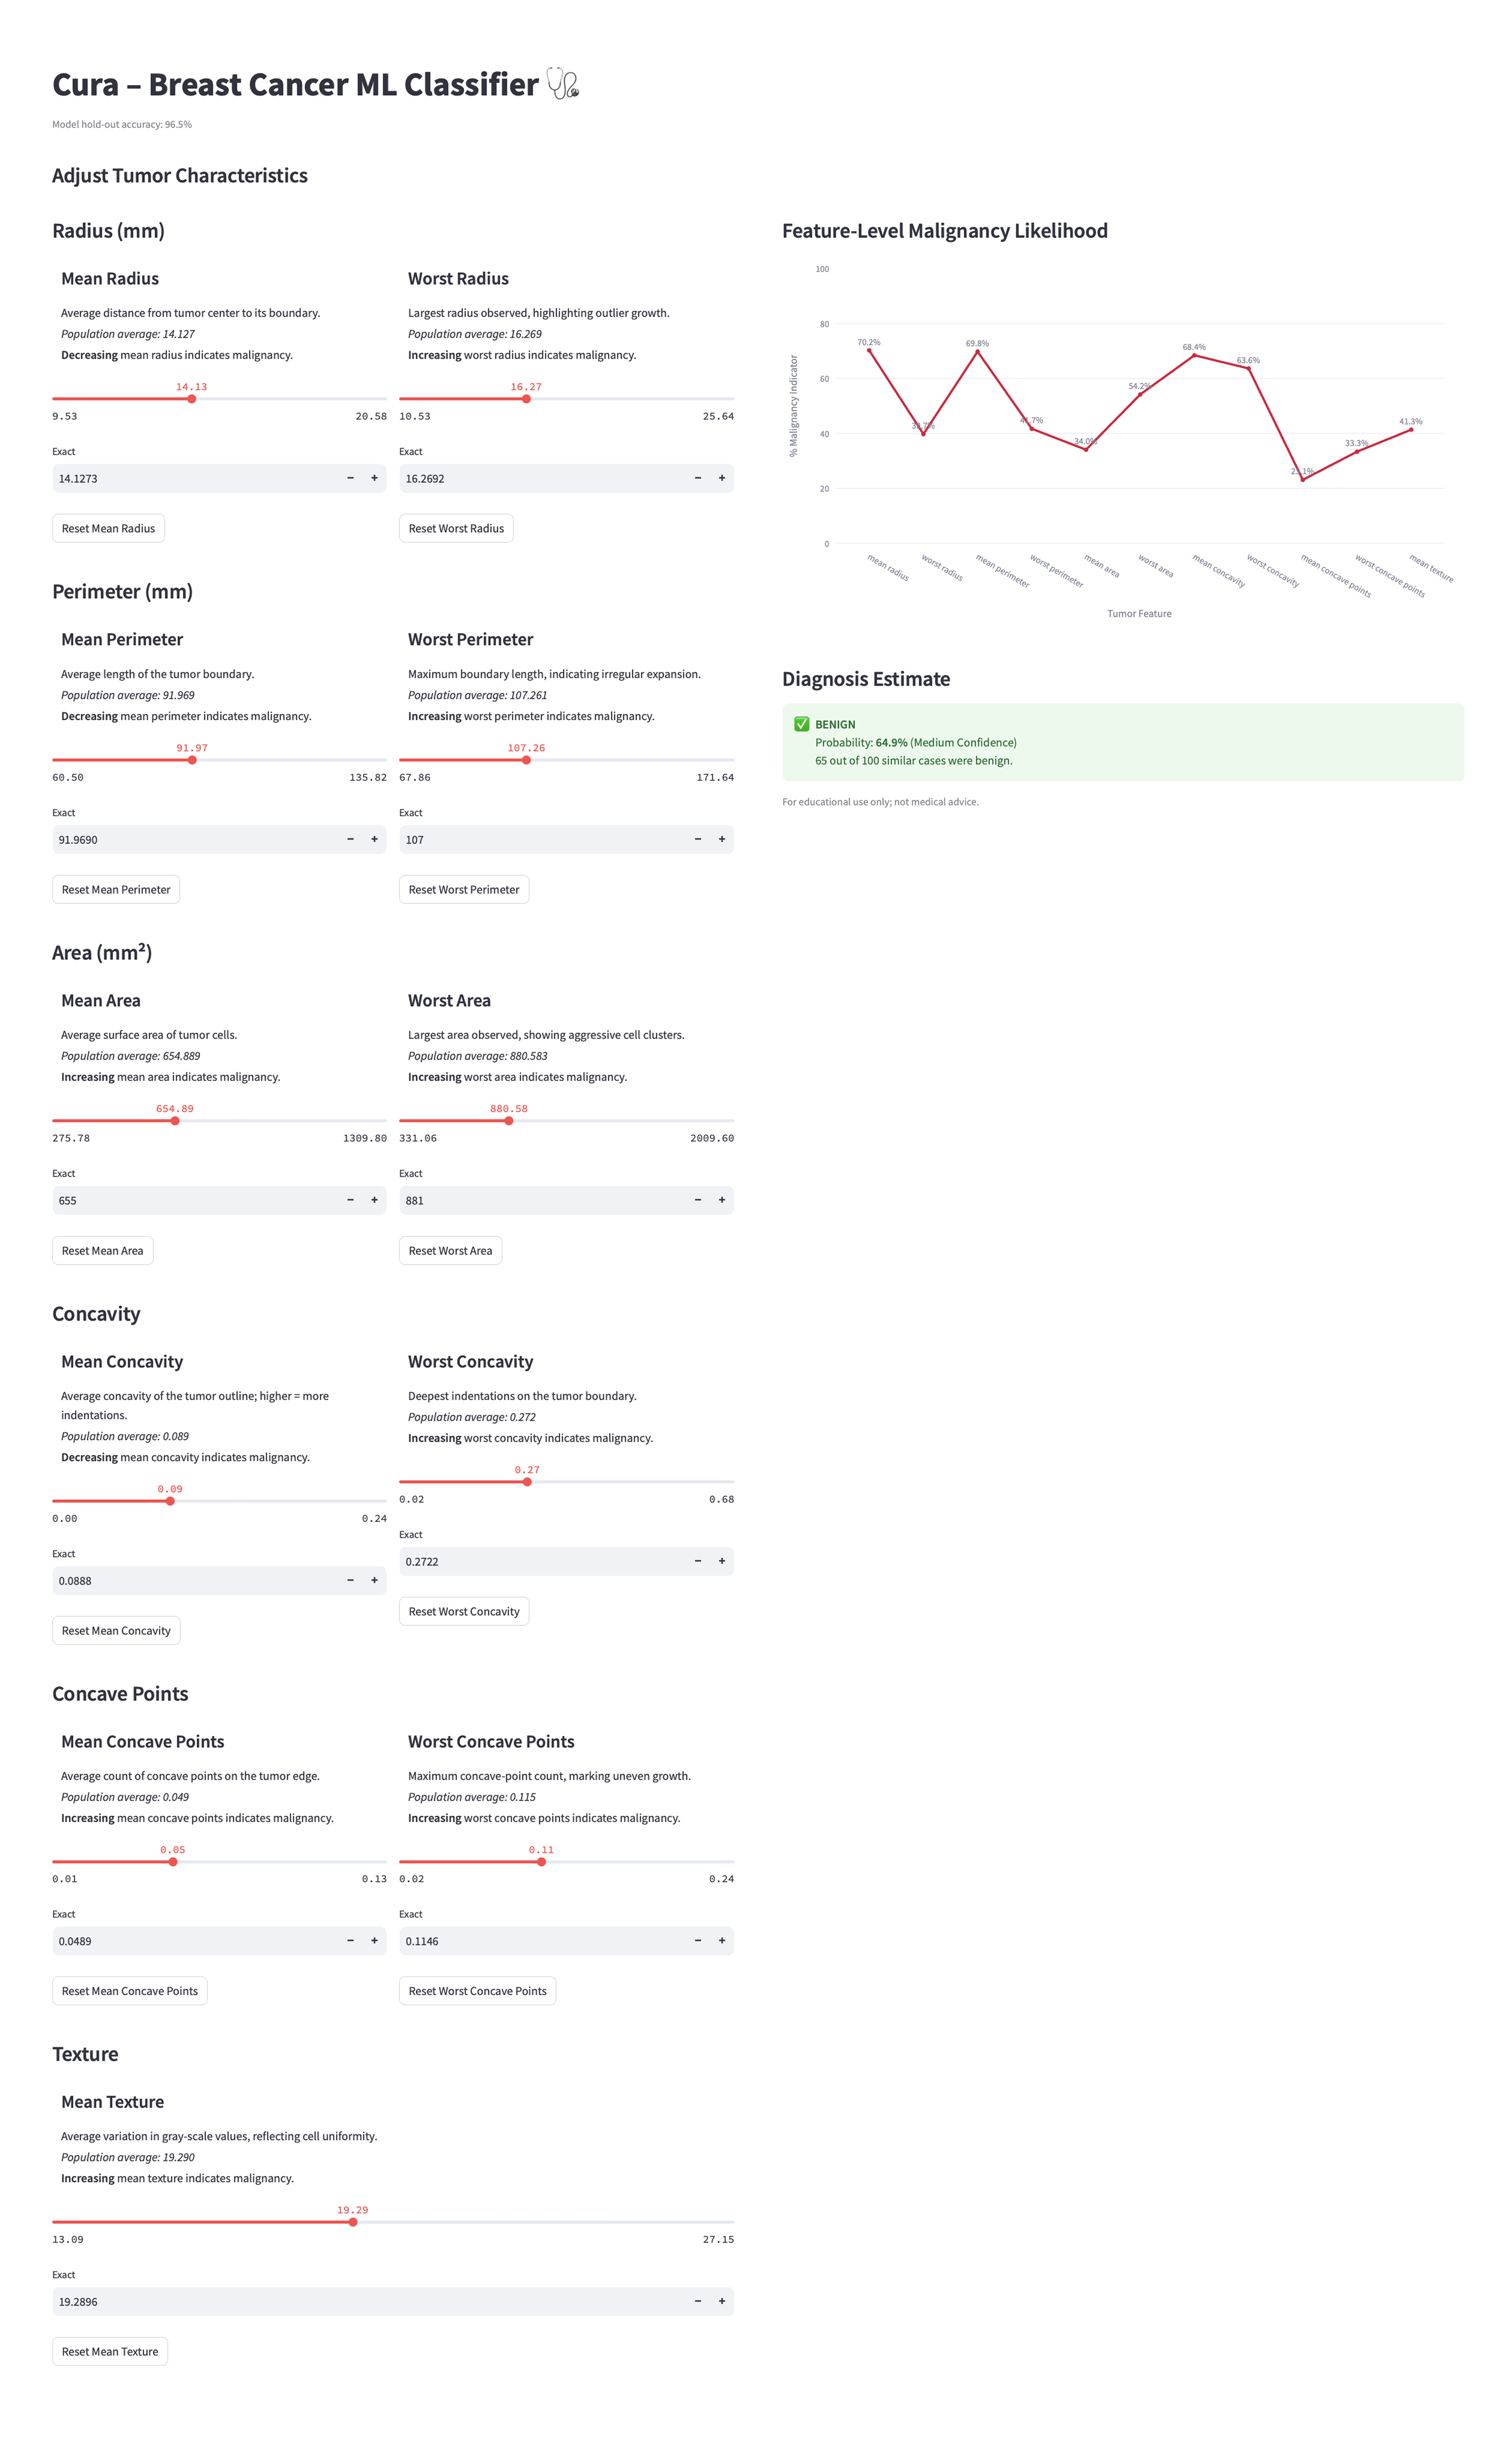
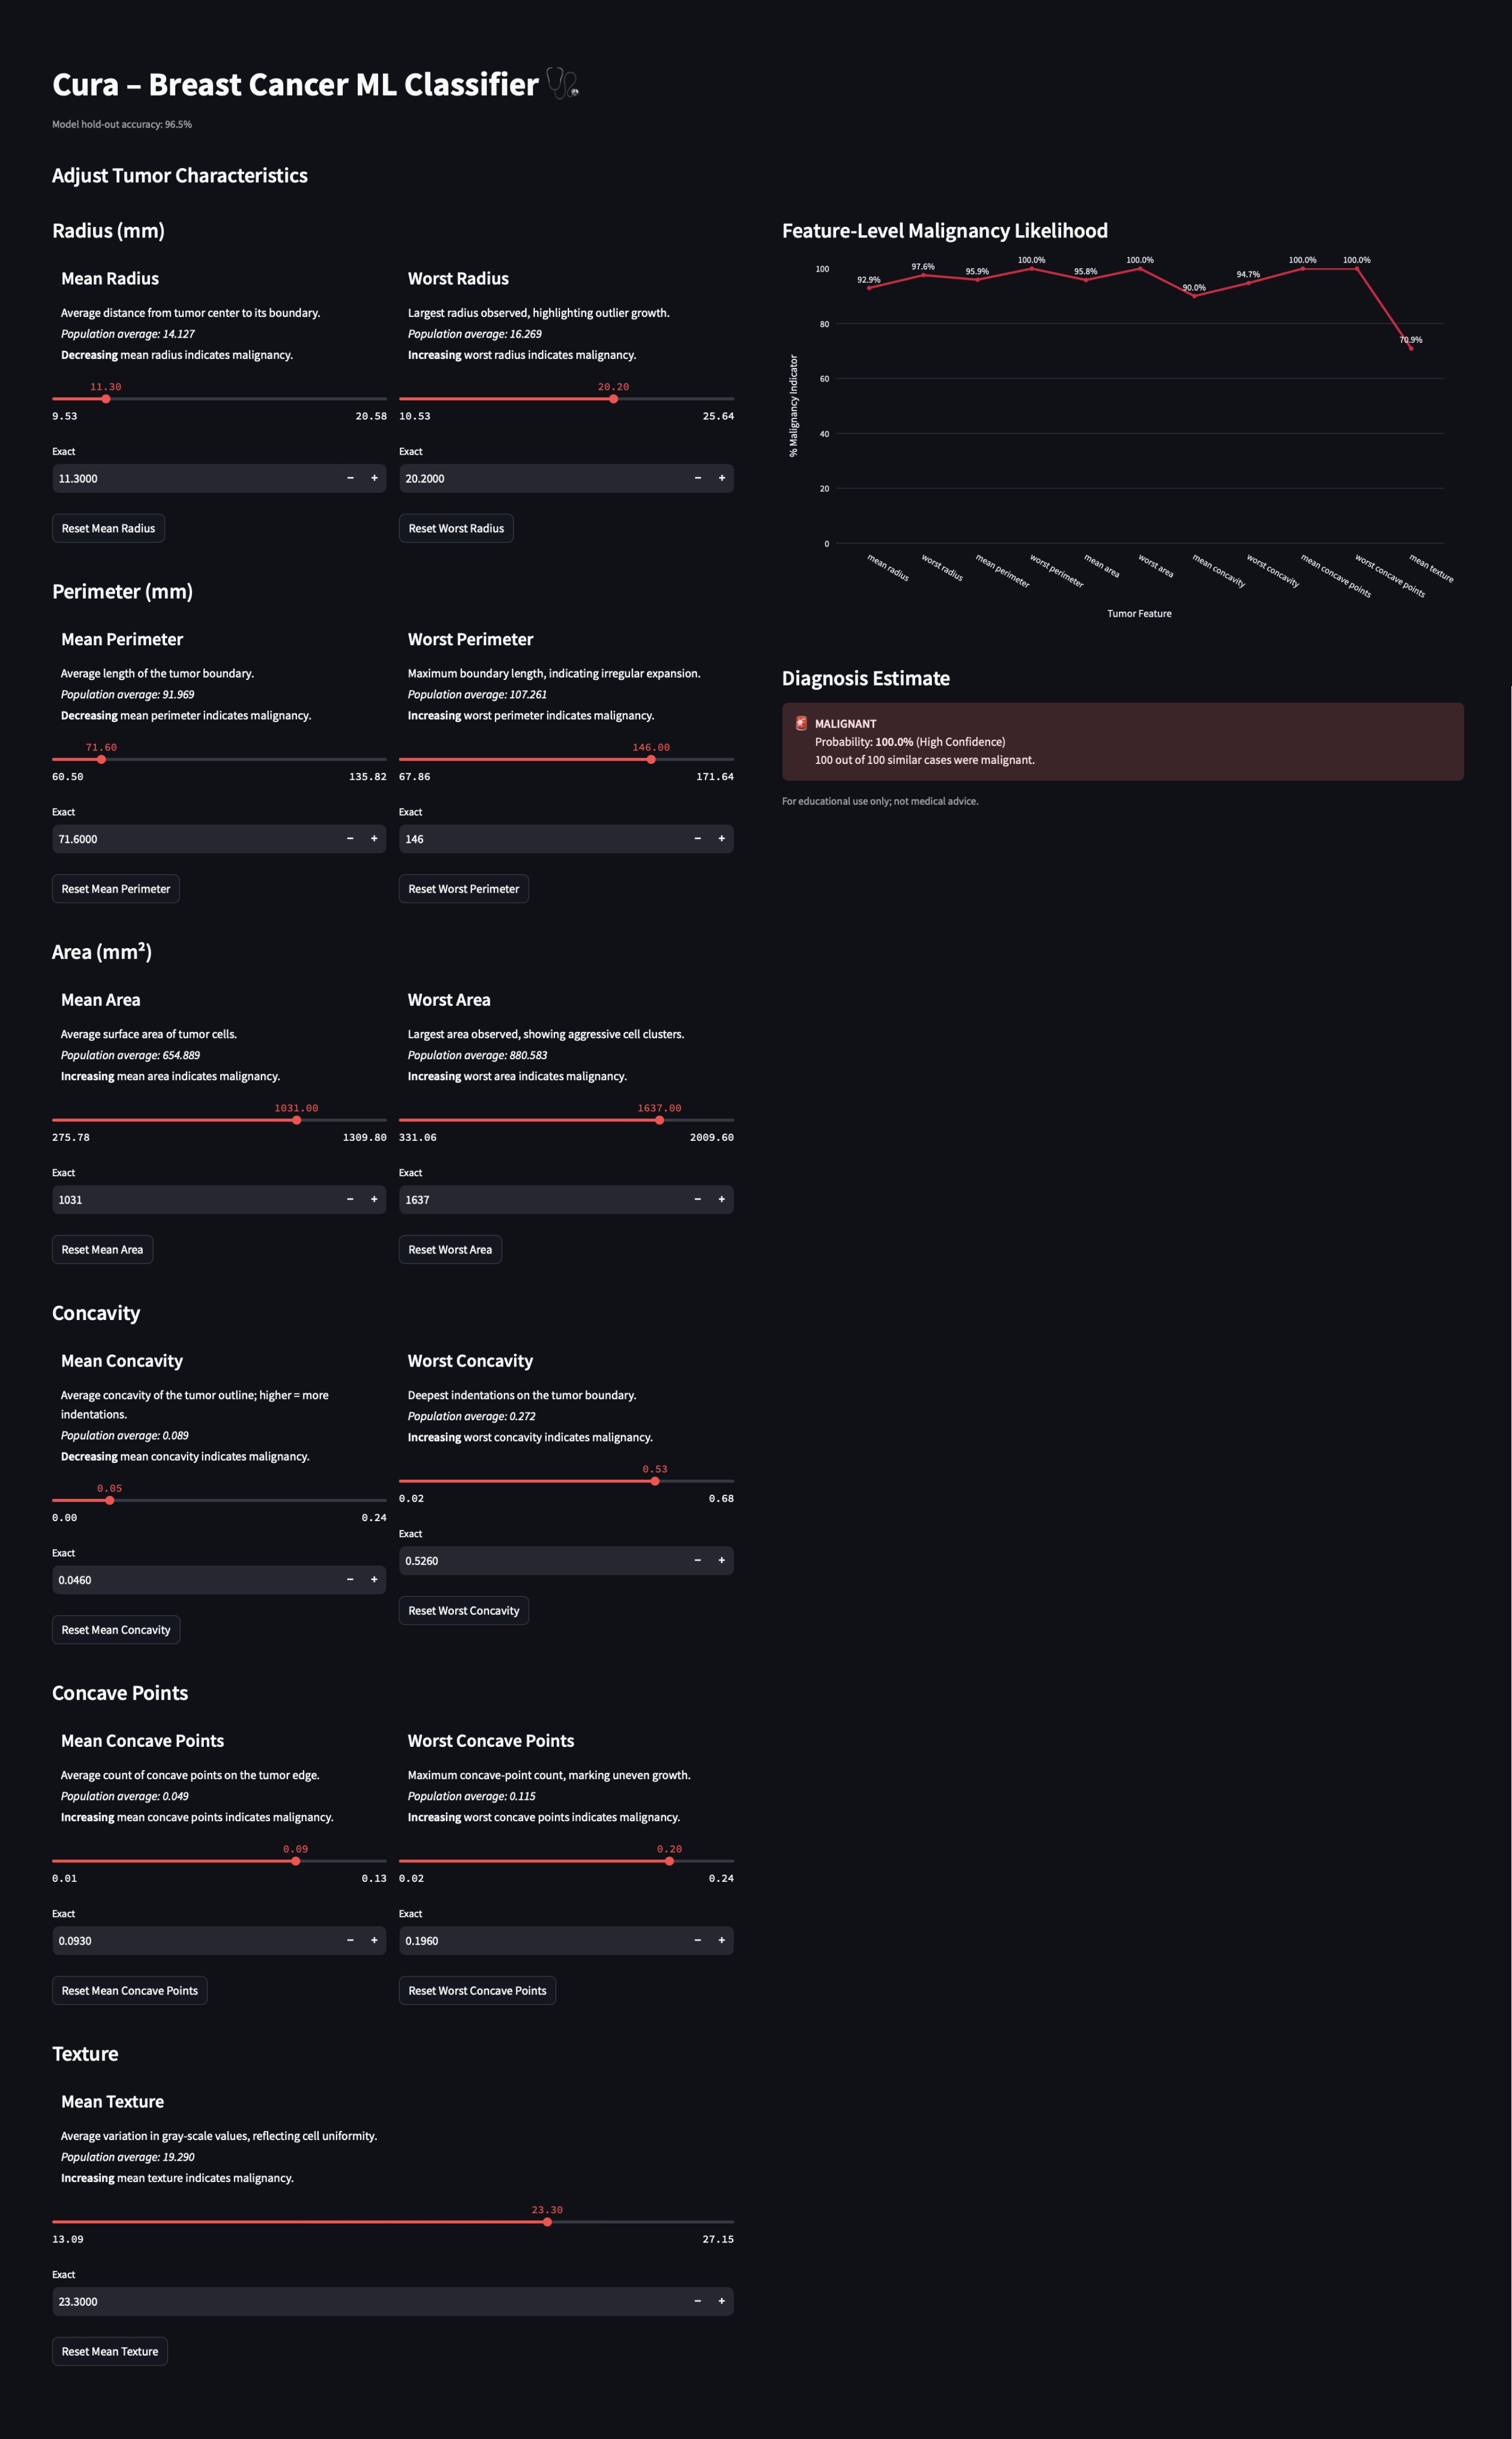
By combining model behavior, pattern analysis, and literature on breast cancer diagnostic processes, I mapped out the most impactful pain points: unreliable feature weighting, lack of transparency, edge cases, and cognitive overload. Each design decision below directly addresses these breakdowns with targeted interface responses.
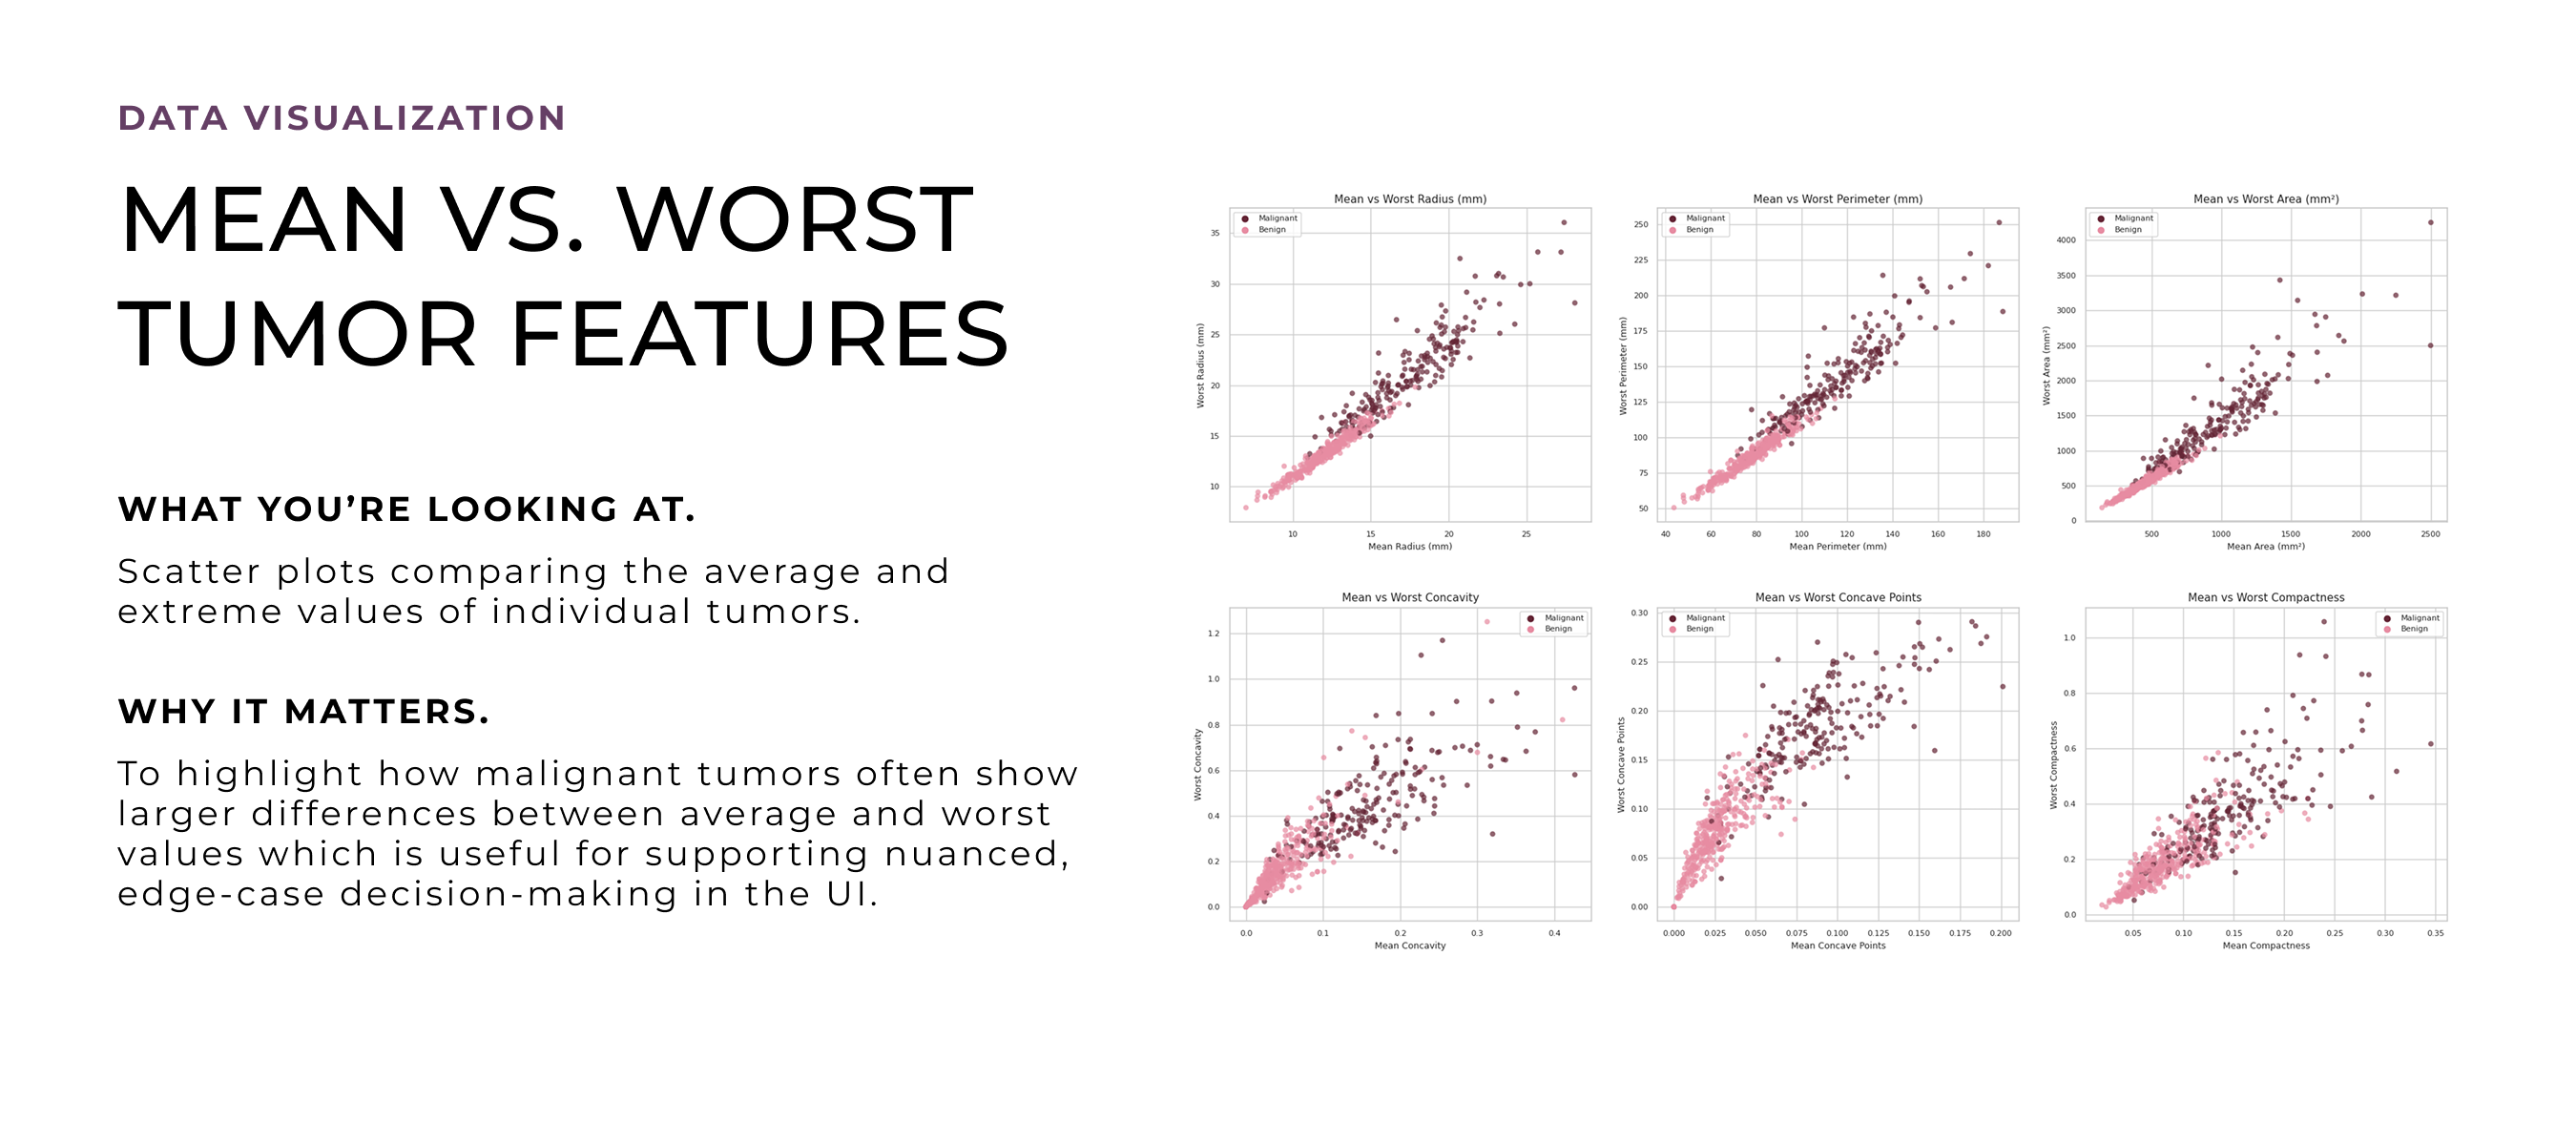
Radiologists don’t just look at a tumor’s ‘average’ size, they also zero in on its single most abnormal spot in a single patient. Missing that one extreme region can lead to under-diagnosis.
"Existing breast imaging studies reported the entropy, mean, minimum, and maximum as important features."
Breakup recovery is rarely linear. We synthesized insights from research, surveys, and interviews to map how emotions and support needs shift over time, helping identify moments when people feel most overwhelmed and what support Repose should provide at each stage.
Many people described feeling stuck after a breakup, seeking clarity, reassurance, and a sense of progress. Using the Jobs-to-be-Done framework helped translate these needs into clear goals that could guide product decisions, shaping Repose’s value proposition and feature priorities.
“When I feel like I wasn’t enough, I want to hear from others who’ve been through it, so I don’t feel broken and alone.”
“When I keep replaying the breakup, I want to find clarity to make sense of what happened, so I can stop fixating and spiraling.”
“When I’m overwhelmed and panicked, I want to feel emotional relief by grounding myself, so I can get through the day.”
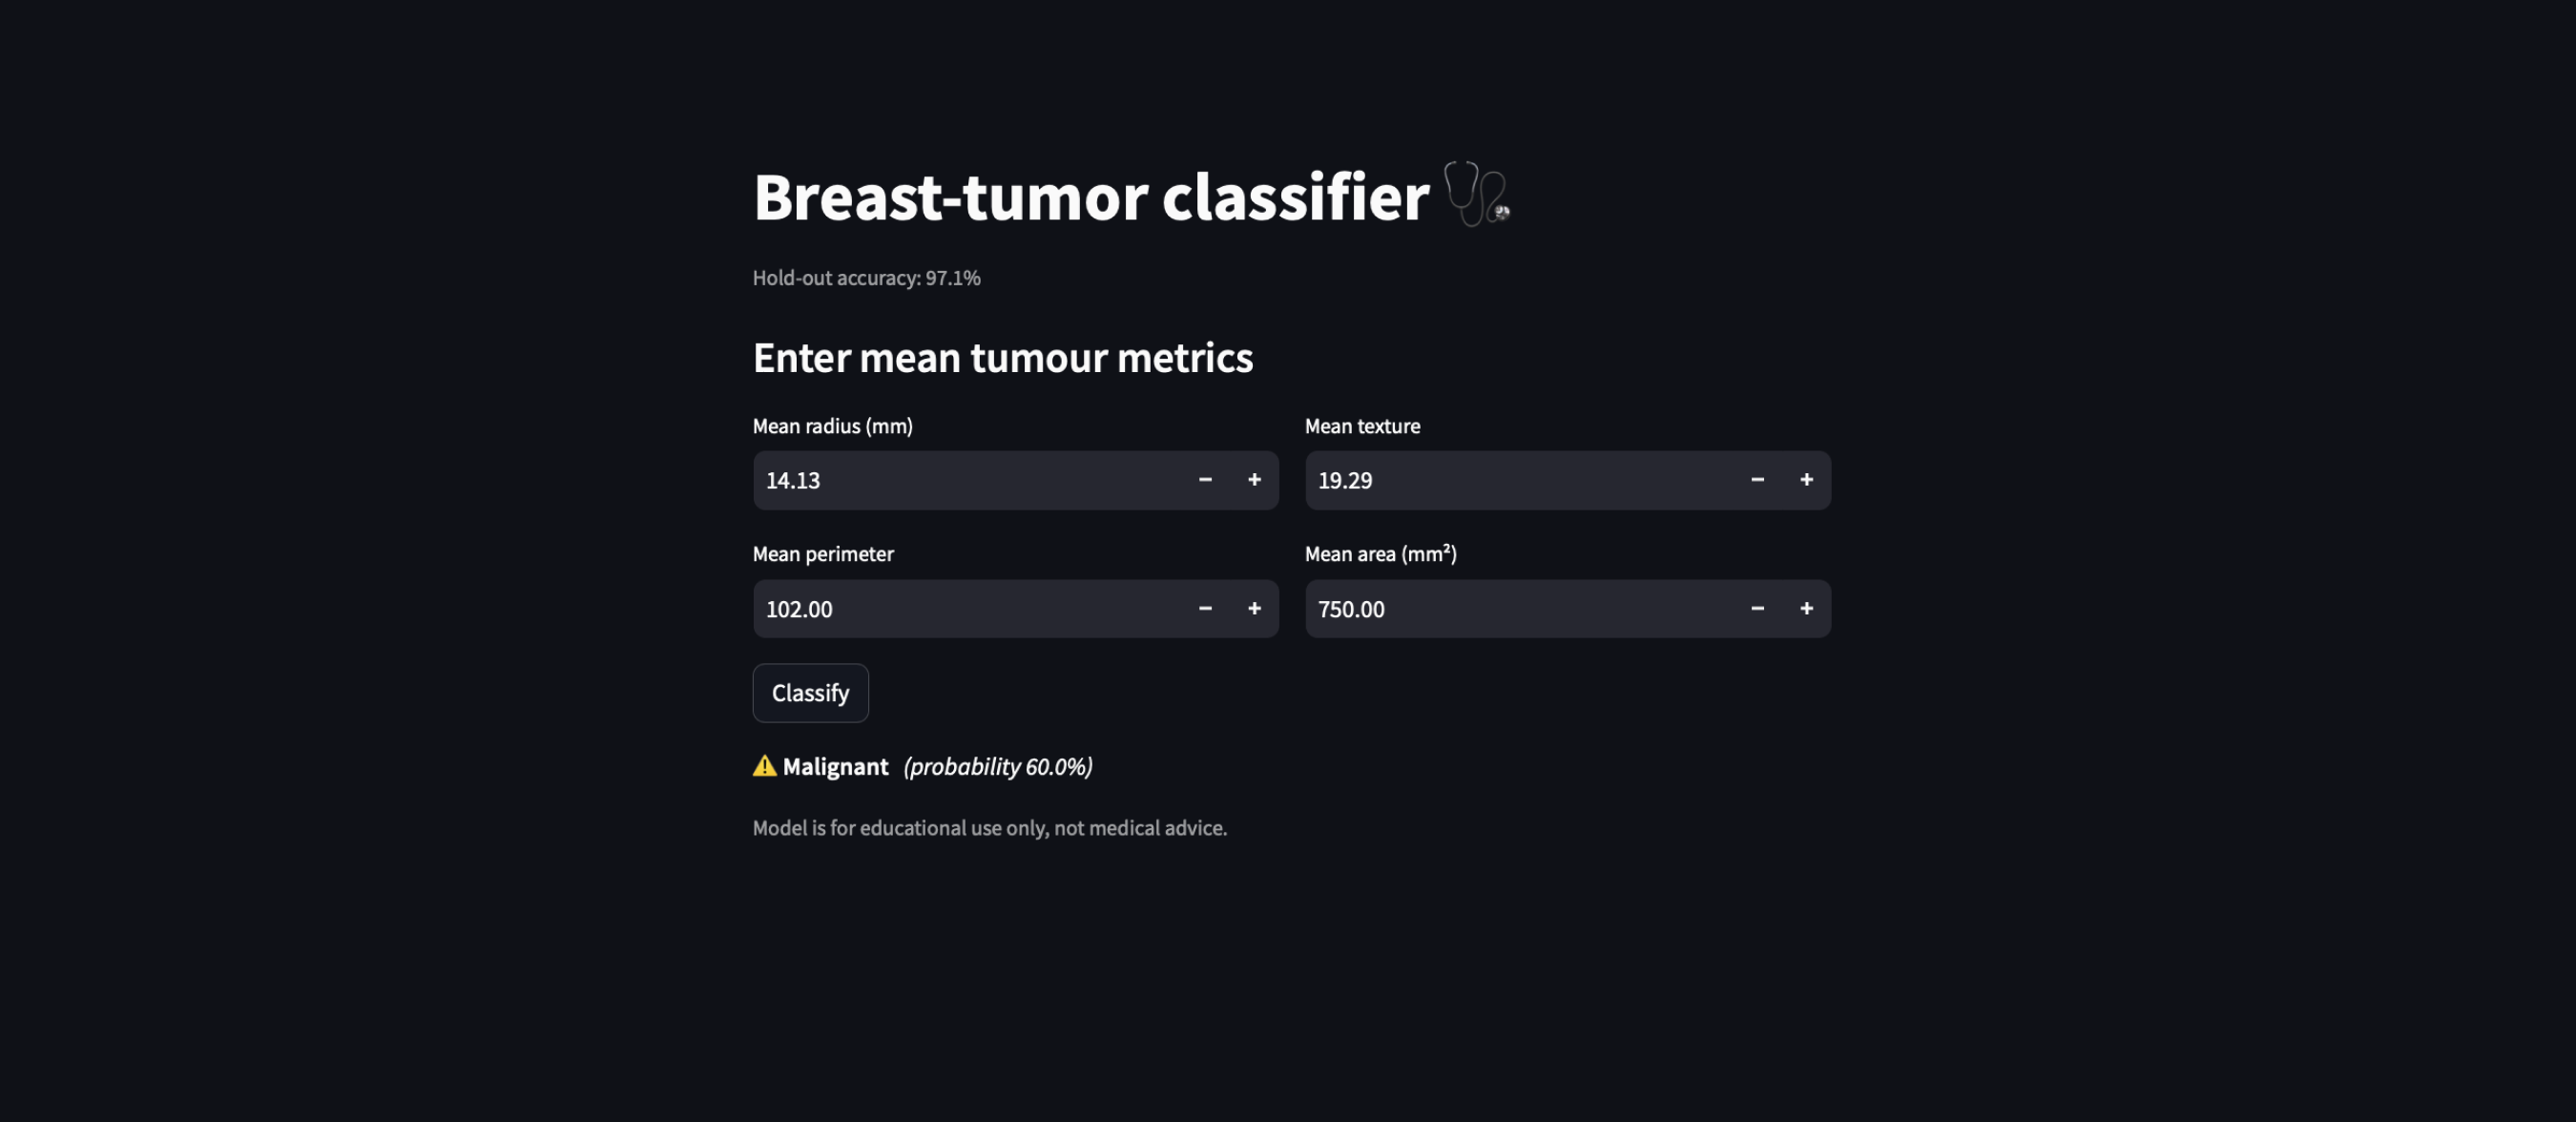
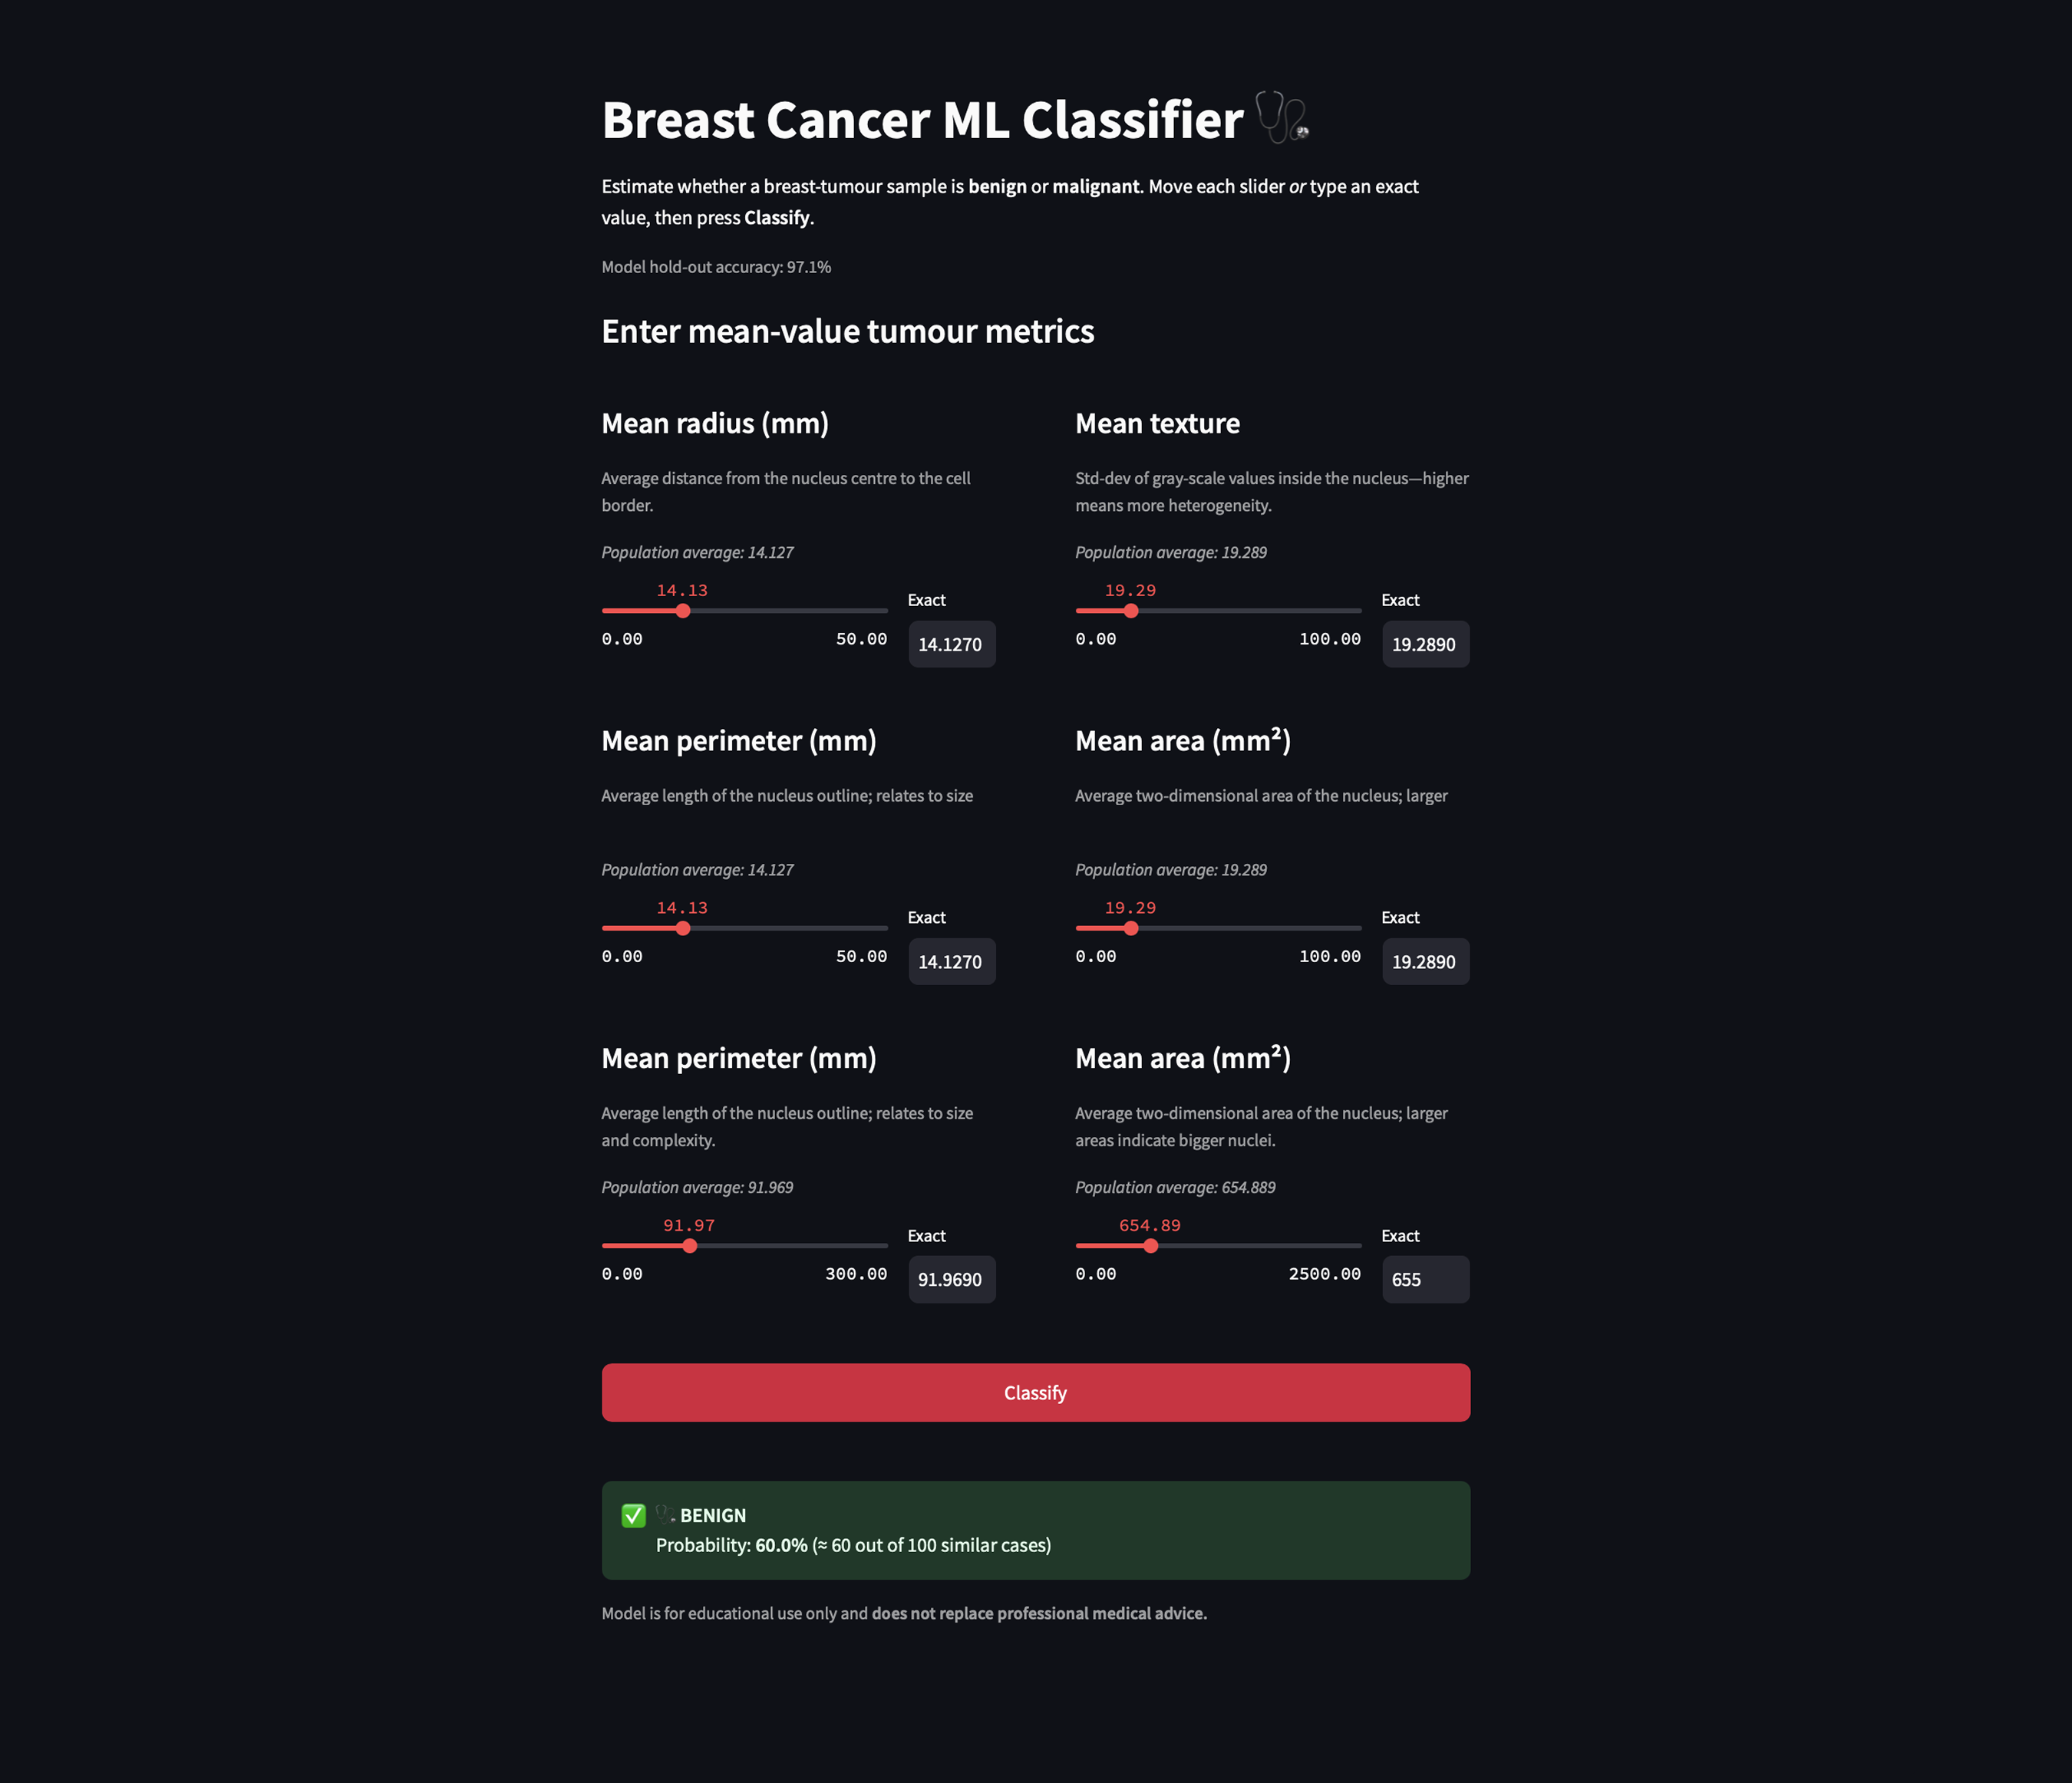
I co-built the interface using Streamlit and iterated directly in code (using vibe-coding), guided by user needs and model behavior. Streamlit allowed me to maintain full control over the model logic while rapidly prototyping interfaces that stayed true to the algorithm’s outputs. Unlike visual design tools, Streamlit let me directly connect model predictions with interface elements, making it easier to test ideas in real time, adjust how probabilities were framed, surface uncertainty, and experiment with interactive features like sliders, graphs, and confidence estimates.
We created a Business Model Canvas and mapped key customer segments to define Repose’s value, target audiences, and potential paths to reach and support them. This helped ensure the MVP aligned with both user needs and business viability.
Interview insights informed design principles emphasizing privacy, low-risk engagement, and reflection before disclosure, which were shared with stakeholders developing AI mental health tools for aviation.
To ensure Repose was viable and grounded in real user needs, we created a Business Model Canvas and mapped out our customer segments early on. This helped us define our core value, identify key audiences, and clarify how we would reach and support them. These insights gave us the confidence to move forward with a focused MVP, ensuring our solution remained aligned with both user needs and business goals.
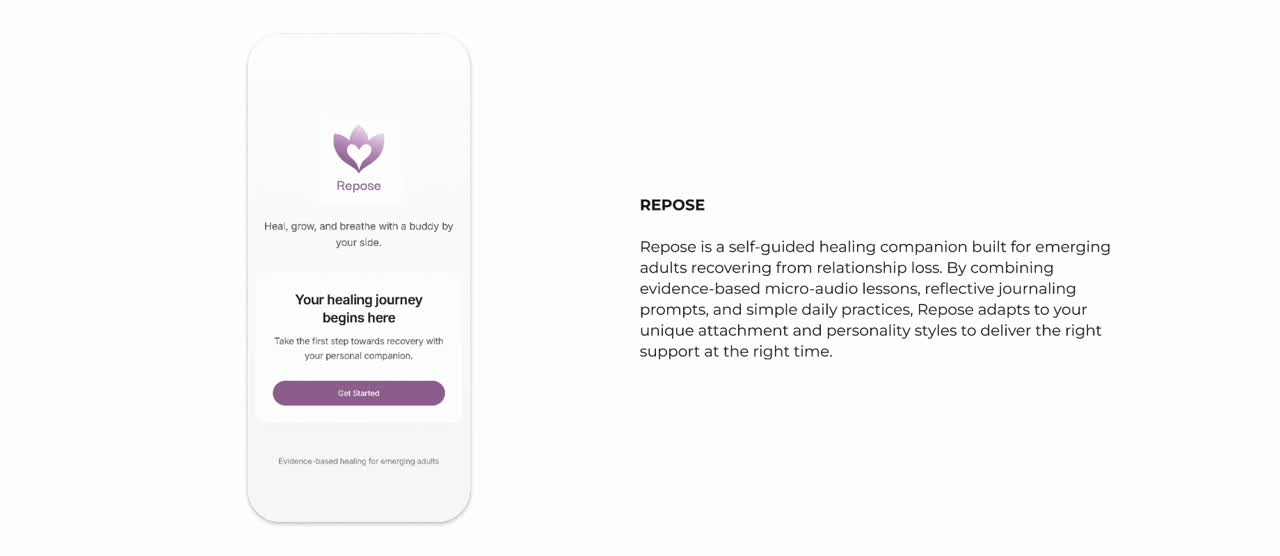
A step-by-step welcome flow that gathers your companion, attachment style, and personality to tailor every lesson and reminder to your needs.
Greets users with a warm introduction, highlights core benefits, and invites them to begin their healing journey
Prompts users to choose a plant or animal companion, immediately tailoring the journey and building an emotional bond
Asks about your typical relationship pattern to customize lessons and exercises around attachment needs
Captures personality/social preference (introvert, extrovert, ambivert) to adjust how and when reminders and content are delivered
A bottom tab bar granting instant access to your daily tools, guided micro-lessons, community discussions, and profile settings for a seamless healing experience.
Central dashboard for daily coping tools all in one glance – breathing, affirmations, journaling, and habit tracking
Bite-sized, personalized audio lessons organized by topic and healing stage, with clear duration and play controls
Anonymous forum where users can browse or join discussions on common breakup challenges, share stories, and find peer support
User settings hub: swap your healing buddy, set daily check-in reminders, and review personal data to keep the experience tailored to you
A central dashboard of mindfulness exercises – breathing, affirmations, habit tracking, and journaling – designed to help you stay present and build healthy routines.
A guided, timed breathing exercise with a simple countdown to help users calm their nervous system and reduce anxiety.
Series of positive, self-compassion statements presented on screen or via voice to counter negative thoughts and boost mindset.
Daily checklist for small, customizable actions (e.g. drink water, take a walk) that encourages building consistency through streaks.
Dual-mode journaling (free-form mood journal or prompt-based session) for users to reflect on feelings, track patterns, and gain insight.
Working on this project was full of surprises. At first, weaving HTML and CSS into Python felt unfamiliar, but that challenge helped me see how code underpins every interface decision. Diving into quantitative research and creating data visualizations revealed diagnostic patterns that static mockups couldn’t capture. Turning my own ML model into an interactive breast cancer app emphasized the power of combining data and design. Watching complex tumor metrics become clear, actionable visuals for radiologists was a true highlight, it was proof that solid research and thoughtful coding can drive meaningful user experiences.
I’m eager to move this prototype into real-world workflows by recruiting radiologists, medical students, and interdisciplinary care teams for hands-on usability testing. Watching how diagnostic teams navigate the interface will uncover pain points and guide refinements to how we surface feature importance and communicate uncertainty. I’ll iterate on the design based on their feedback, then pilot the app in both clinical and educational settings to measure its impact on diagnostic confidence, learning outcomes, and overall workflow efficiency. These steps will ensure the tool truly integrates data-driven insights into everyday diagnostic practice.

Mixed-Method Research | Semi-Structured Interviews | Survey Design and Analysi | Thematic Analysis
Qualitative Research Methods | Customer Segmentation & JTBD Mapping | Research-Strategy Translation


